
Technical indicators
Major Resistance Levels – $0.12 and $0.14
Major Support Levels – $0.06 and $0.04
Dogecoin (DOGE) Price Long-term Prediction: Bullish
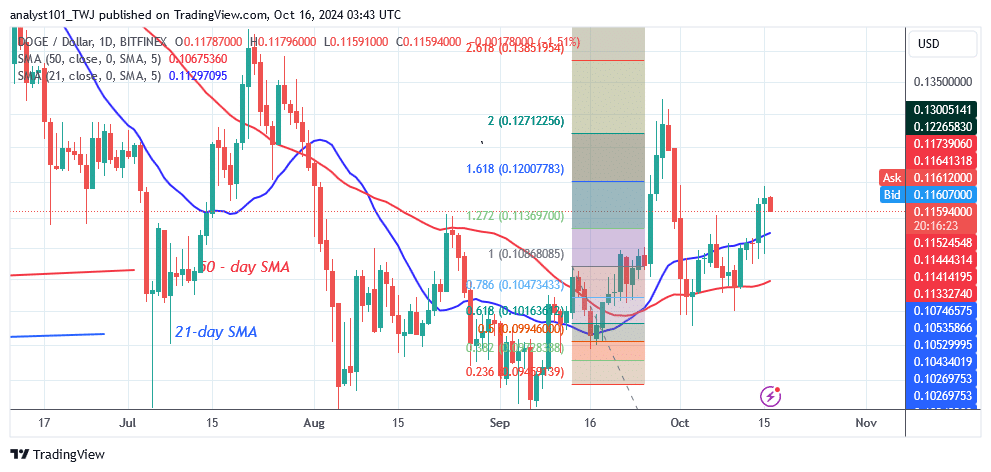
Dogecoin’s (DOGE) price has recovered but faces another roadblock at $0.12. During the first surge, the altcoin peaked at $0.132. Buyers could not maintain the positive momentum above the $0.13 high, resulting in the fall. DOGE dropped below the moving average lines but was stopped by the 50-day SMA.
Dogecoin (DOGE) Indicator Reading
DOGE has maintained its bullish ascent, with price bars remaining above the moving average lines. The moving average lines are trending upward, indicating a current uptrend. In addition, the crypto asset exhibits a bullish crossover, with the 21-day SMA crossing above the 50-day SMA. This represents a bullish signal.
What is the next direction for Dogecoin (DOGE)?
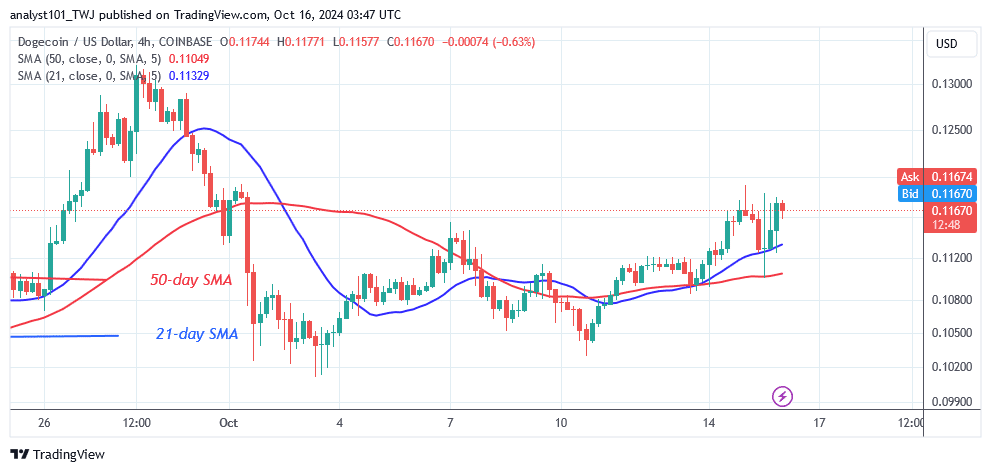
The 4-hour chart shows DOGE correcting upward but faces another roadblock at $0.12. Currently, the upward corrective is encountering another obstacle at $0.12. The altcoin will be forced to a sideways move if the bulls fail to breach the resistance at $0.12. The cryptocurrency signal is favorable as long as the price bars are higher than the moving average lines.
Make money without lifting your fingers: Start using a world-class auto trading solution.
Note: Learn2.Trade is not a financial advisor. Do your research before investing your funds in any financial asset or presented product or event. We are not responsible for your investing results.


