

Market Analysis – March 17
GBPUSD is poised for a significant downtrend amidst bearish signals. The Simple Moving Average (SMA) indicator (9-period) is currently positioned at $1.29190, slightly below the current price of $1.29340, indicating a potential reversal. Additionally, the Relative Strength Index (RSI) is hovering around 68.56, approaching the overbought threshold of 70, suggesting that the pair is losing upward momentum. This combination of an overextended RSI and a price trading above the SMA signals that the bullish momentum may be weakening, increasing the likelihood of a bearish correction.
GBPUSD Key Levels
Supply Levels: $1.30470, $1.32500, $1.34340
Demand Levels: $1.27140, $1.23000, $1.21000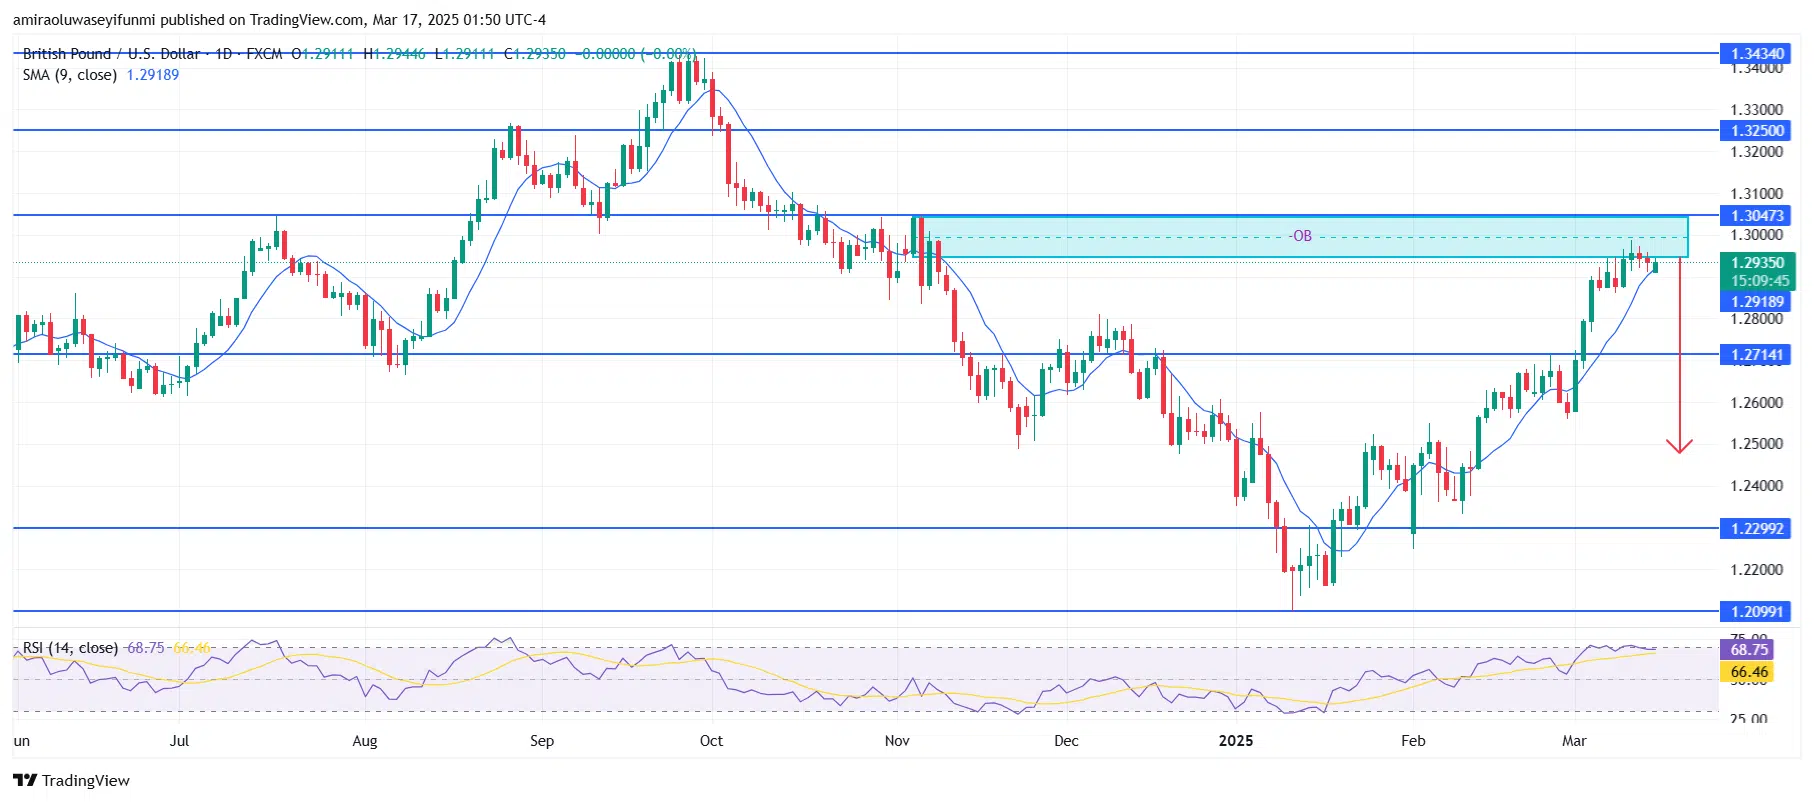
GBPUSD Long-Term Trend: Bearish
GBPUSD Short-Term Trend: Bearish
On the 4-hour chart, GBPUSD exhibits clear bearish signals after failing to break through the $1.30470 resistance zone. A Change of Character (CHoCH) near $1.28610 suggests a shift from bullish to bearish momentum. The Simple Moving Average (SMA 9) at $1.29350 is now acting as dynamic resistance, reinforcing downward pressure. If the price falls below $1.28610, a further decline toward the $1.27140 support level is likely. Traders relying on forex signals may watch for confirmation of these bearish movements to identify potential trading opportunities.
Make money without lifting your fingers: Start using a world-class auto trading solution
How To Buy Lucky Block
Note: Learn2.trade is not a financial advisor. Do your research before investing your funds in any financial asset, product, or event. We are not responsible for your investment results.


