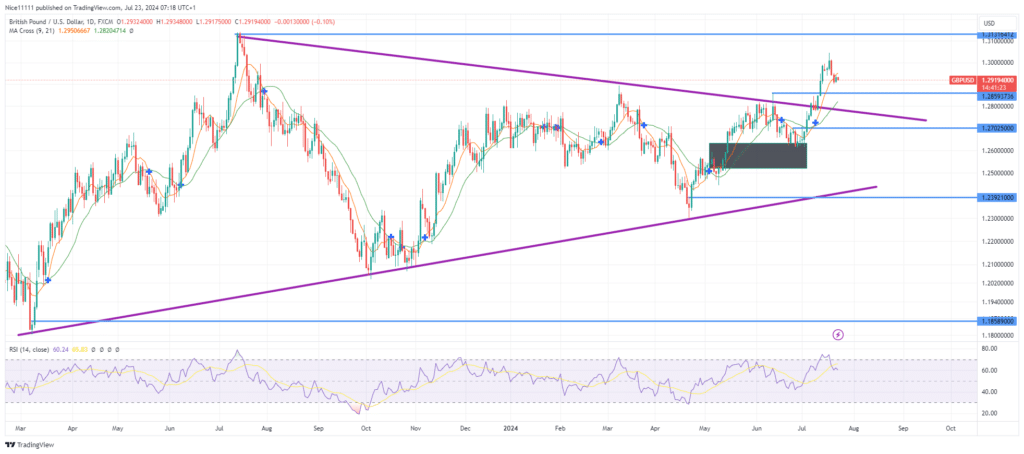
GBPUSD price has successfully broken out of a significant symmetrical triangle pattern on the daily chart. The price movement above the resistance border surpassed two major highs, forming a downward trend line. Currently, GBPUSD has established a swing high at the psychological price of 1.3000, indicating a retracement towards the demand zone of 1.2860, characterized by a bullish order block.
The Relative Strength Index (RSI) signaled that the GBPUSD market was overbought upon reaching the psychological price of 1.3000, leading to the formation of a swing high and subsequent price decline. The price has now reached the Moving Average period nine, while the Moving Average period twenty-one remains below, indicating a continued bullish trend.
The bullish breakout above the downward sloping trendline resulted in the formation of a bullish order block, followed by a significant price increase. The current pullback to the bullish order block appears to be a healthy correction, seeking support for the continuation of the uptrend.
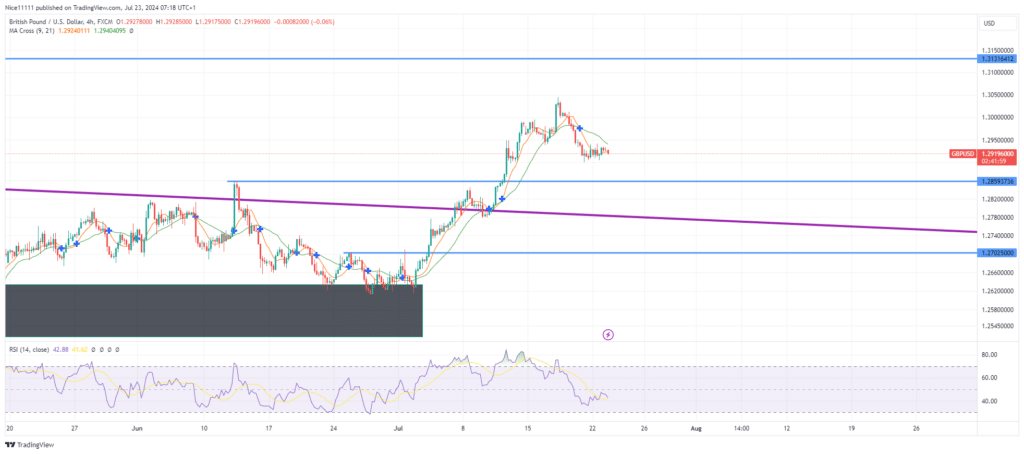
GBPUSD Short-term Trend: Bearish
On the lower timeframe (4 hours), the market direction has turned bearish. The price is now below the Moving Averages, indicating a price decline. To utilize the best forex signals telegram channels can offer, it is advisable to avoid counter-trend orders to increase strike rate. Shorting may be considered when scalping on a much lower timeframe, using the 4-hour chart as the higher timeframe reference.
Note: Learn2.trade is not a financial advisor. Do your research before investing your funds in any financial asset, product, or event. We are not responsible for your investment results.
Trade on MT4 with Leverage up to 1:500! Trade on MT4 with Leverage up to 1:500!
X
We use cookies to ensure that we give you the best experience on our website. If you continue to use this site we will assume that you are happy with it.