
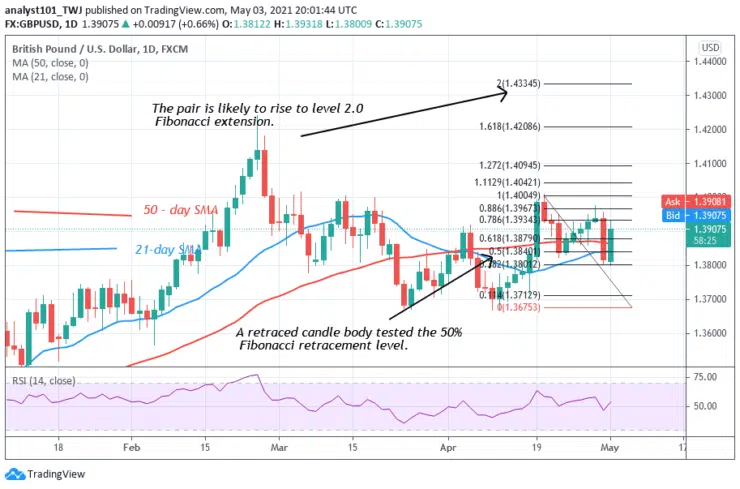
Daily Chart Indicators Reading:
The 21-day and 50-SMAs are sloping upward indicating the uptrend. The Pound is at level 53 of the Relative Strength period 14. It indicates that the pair is in the uptrend zone and capable of rising.
GBP/USD Medium-term Trend: Ranging
On the 4-hour chart, the pair has been in a sideways move below level 1.4000. Since April 20, the bulls are yet to break the resistance level. On April 20 uptrend; a retraced candle body tested the 50% Fibonacci retracement level. The retracement indicates that the pair is likely to rise to level 2.0 Fibonacci extension or level 1.4295.


