Don’t invest unless you’re prepared to lose all the money you invest. This is a high-risk investment and you are unlikely to be protected if something goes wrong. Take 2 minutes to learn more
Market Analysis – September 12
GBPUSD buyers migrate close to the 1.25500 key level. The pair has been experiencing a bearish trend for the past few weeks as sellers have dominated the market. The price has dropped from above the 1.30000 major level in July to below the 1.25500 key level in September. This indicates strong selling pressure. However, the buyers have not given up yet, as they have shown some signs of recovery in recent days.
GBPUSD Important Levels
Resistance Levels: 1.30050, 1.27470
Support Levels: 1.23110, 1.25500
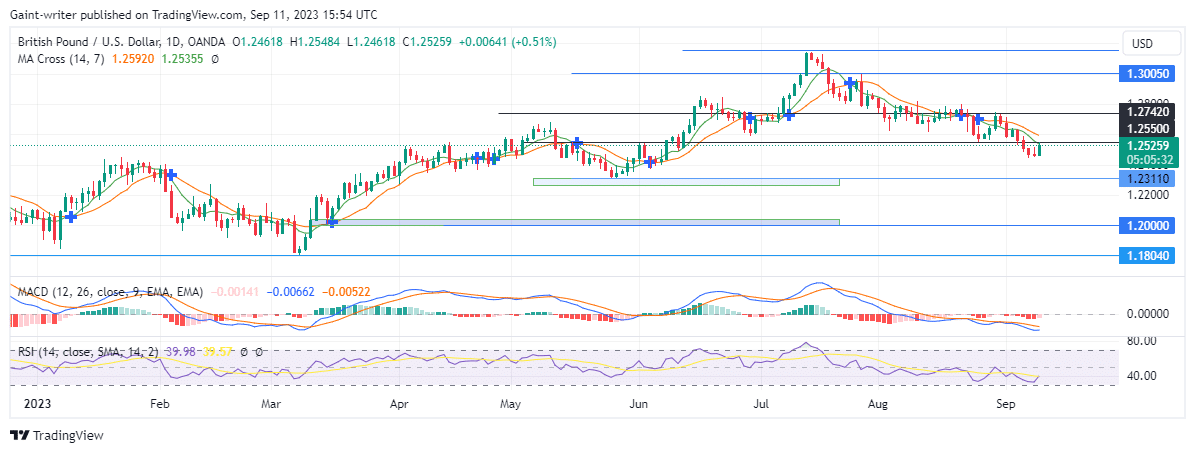
GBPUSD Long-Term Trend: Bearish
The price has also been trading below the 7-day and 14-day moving averages, which act as dynamic resistance levels. The MACD indicator is in negative territory, confirming the bearish momentum.
I
However, the buyers have also shown some strength in the market, as they have managed to create a bullish pullback. The price has bounced back from the 1.24800 low and moved closer to the 1.25500 key level. This was previously a support and now acts as a resistance. The buyers have also pushed the price above the 7-day moving average, which may indicate a short-term bullish reversal.
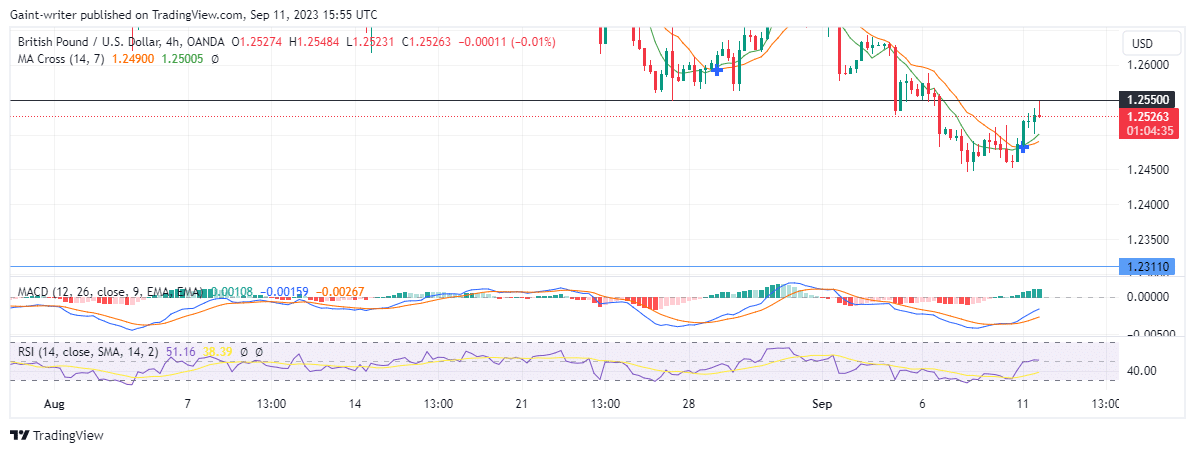
GBPUSD Short-Term Trend: Bullish
The 4-hour chart of GBPUSD reveals more details about the recent price action. The price is currently testing the 14-day moving average on the daily chart. If the buyers fail to break above this level, the sellers may take advantage of this opportunity. However, if the buyers manage to break above this level, they may trigger a bullish breakout towards higher levels, such as 1.26000 or 1.27000.
I
You can purchase Lucky Block – Guide, Tips & Insights | Learn 2 Trade here. Buy LBLOCK
Note: Learn2.trade is not a financial advisor. Do your research before investing your funds in any financial asset or presented product or event. We are not responsible for your investing results.
- Broker
- Min Deposit
- Score
- Visit Broker

- Award-winning Cryptocurrency trading platform
- $100 minimum deposit,
- FCA & Cysec regulated
9.8

- 20% welcome bonus of upto $10,000
- Minimum deposit $100
- Verify your account before the bonus is credited
9
- Fund Moneta Markets account with a minimum of $250
- Opt in using the form to claim your 50% deposit bonus
9
Learn to Trade
Never Miss A Trade Again

step 1
Signal Notification
Real-time signal notifications whenever a signal is opened, closes or Updated

step 2
Get Alerts
Immediate alerts to your email and mobile phone.

step 3
Entry Price Levels
Entry price level for every signal Just choose one of our Top Brokers in the list above to get all this free.