
Key Resistance Levels: 1.4200, 1.4400, 1.4600
Key Support Levels: 1.3400, 1.3200, 1.3000
GBP/USD Price Long-term Trend: Bullish
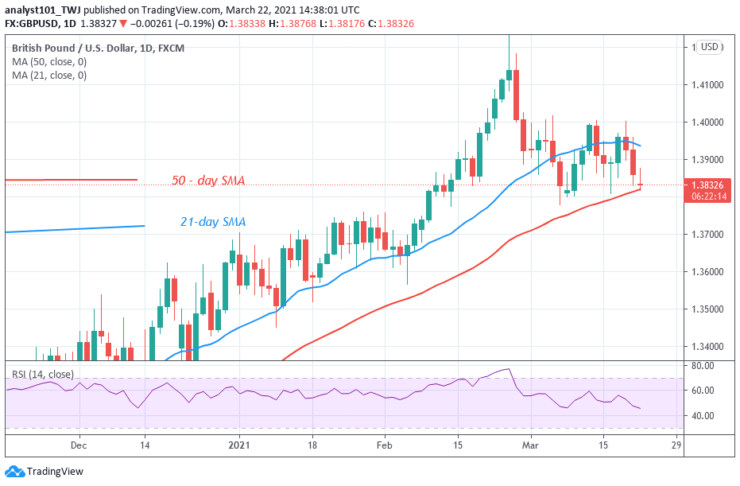
GBP/USD upward move has been interrupted at level 1.4200. The pair fell to level 1.3800 support and resumed fluctuation between levels 1.3800 and 1.400. The pair has retested the resistance at level 1.400 but faces rejection. The market will resume an upward move if the resistance is breached. The currency pair has fallen to the lower price range. The support is likely to hold as there are bullish signals.
Daily Chart Indicators Reading:
The moving averages are sloping upward indicating the upward move. The pair has fallen to level 45 of the Relative Strength Index period 14. This indicates that the Yen is in the downtrend zone and below the centerline 50.
GBP/USD Medium-term Trend: Bearish
On the 4-hour chart, the market is presently falling. The pair has fallen to level 1.3820 and pulled back. Meanwhile, a retraced candle body tested the 78.6% Fibonacci retracement level on March 22. The retracement indicates that price will fall to level 1.272 Fibonacci extension.


