

Key Resistance Levels: 150.000, 152.000, 154.000
Key Support Levels: 146.000, 144.000, 142.000
GBP/JPY Price Long-term Trend: Bullish
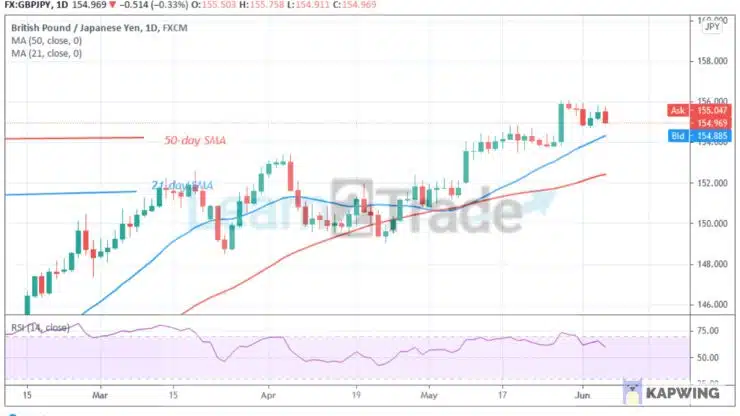
GBP/JPY pair is in an uptrend. On Mat 27, the pair reached the high of level 156.00. The currency pair was resisted as the market resumed a downward move. The uptrend will resume if price retraces and finds support above the moving averages. The selling pressure will persist if price breaks below the moving averages.
Daily Chart Indicators Reading:
GBP/JPY is at level 59 of the Relative Strength Index period 14. This indicates that the pair is in the uptrend zone and above the centerline 50. The 21-day and 50-day SMAs are sloping upward indicating the uptrend.
GBP/JPY Medium-term Trend: Bearish
On the 4-hour chart, the pair is in a downward move. The pair is facing rejection twice at level 156.00. On June 1 downtrend; a retraced candle body tested the 38.2% Fibonacci retracement. The pair is likely to fall to level 2.618 Fibonacci extension or level 152.79,


