Don’t invest unless you’re prepared to lose all the money you invest. This is a high-risk investment and you are unlikely to be protected if something goes wrong. Take 2 minutes to learn more
Market Analysis August 30
FTSE bulls continue to channel their strength up north. This month, the bulls have been dominant. Therefore, the likelihood of the bullish trend persisting into the next month is high. This week, the market level of 7393.00 has been surpassed due to a bullish expansion.
FTSE Important Levels
Resistance Levels: 7986.90, 7717.60
Support Levels: 7393.30, 7215.60
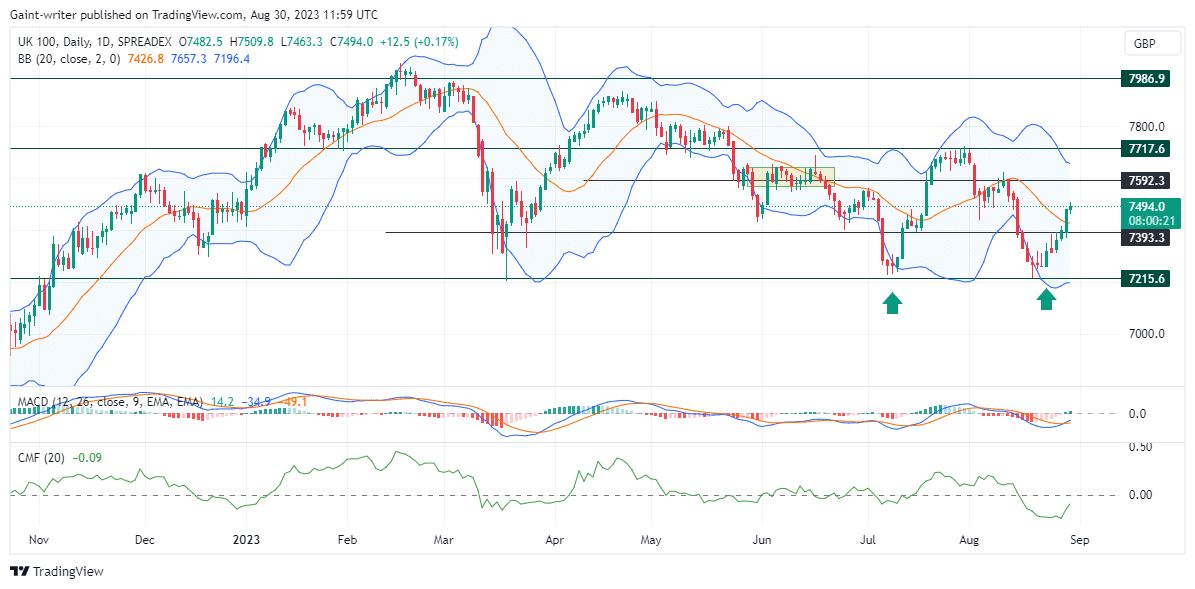
FTSE Long-Term Trend: Bullish
In early July, buyers changed the market narrative as the price was initially trending downward. Following profit-taking by sellers around the market level of 7215.60, buyers made gains and closed at the 7717.60 zone. However, sellers then pushed the price back down to the 7215.60 level. On the daily chart, buyers are currently gaining strength, breaking through the middle level of the Bollinger Bands indicator. This signifies an increase in buying pressure and potential bullish momentum.
As demand continues to rise, the FTSE bulls may maintain dominance in the market in the coming weeks. It suggests that the level of 7592.30 will likely be breached in the days ahead. The MACD (Moving Average Convergence and divergence) indicator indicates a signal cross below 0.00, implying that more buyers can enter the market. Additionally, the bullish histogram of the MACD is increasing, and the Chaikin Money Flow indicator is responding to the bullish pace.
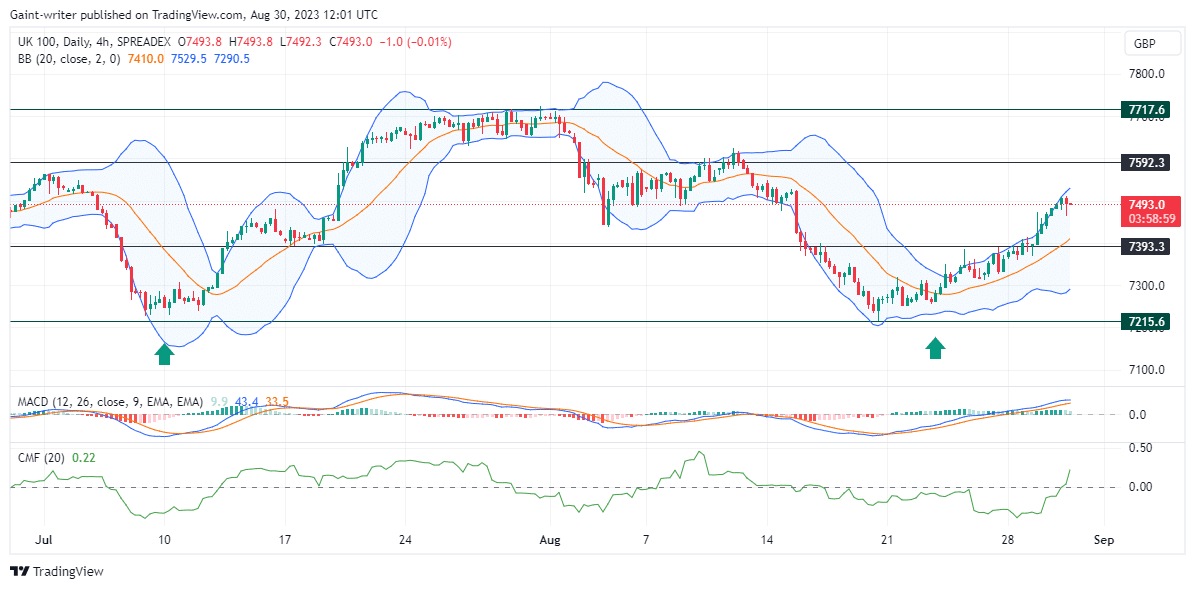
FTSE Short-Term Trend: Bullish
On a shorter timeframe, the bulls are still maintaining their momentum. Therefore, further bullish tendencies are expected in the FTSE market in the days to come.
You can purchase Lucky Block – Guide, Tips & Insights | Learn 2 Trade here. Buy LBLOCK
Note: Learn2.trade is not a financial advisor. Do your research before investing your funds in any financial asset or presented product or event. We are not responsible for your investing results.
- Broker
- Min Deposit
- Score
- Visit Broker

- Award-winning Cryptocurrency trading platform
- $100 minimum deposit,
- FCA & Cysec regulated
9.8

- 20% welcome bonus of upto $10,000
- Minimum deposit $100
- Verify your account before the bonus is credited
9
- Fund Moneta Markets account with a minimum of $250
- Opt in using the form to claim your 50% deposit bonus
9
Learn to Trade
Never Miss A Trade Again

step 1
Signal Notification
Real-time signal notifications whenever a signal is opened, closes or Updated

step 2
Get Alerts
Immediate alerts to your email and mobile phone.

step 3
Entry Price Levels
Entry price level for every signal Just choose one of our Top Brokers in the list above to get all this free.