Resistance Level: 7500, 7600, 7700
Support Level: 7300, 7200, 7100
FTSE 100 (UKX) Long-term Trend: Ranging
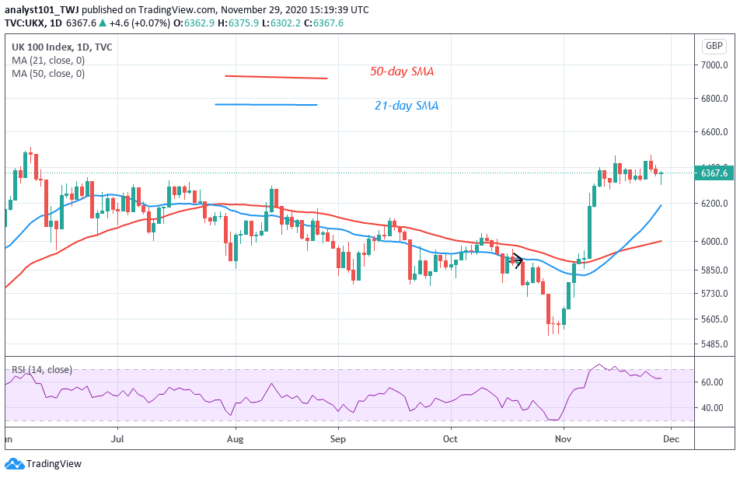
FTSE 100 is in an upward movement since November 2. The share has reached the overbought region of the market. On November 16 and 25, the candlesticks possess long wicks. These candlesticks indicate that there is strong selling pressure at a higher price level. The share is likely to fall.
Daily Chart Indicators Reading:
The 21-day SMA and 50-day SMA are sloping upward indicating the uptrend. Presently, the share is at level 65 of the Relative Strength Index. The market is in an uptrend zone and above the centerline 50.
FTSE 100 (UKX) Medium-term Trend: Bullish
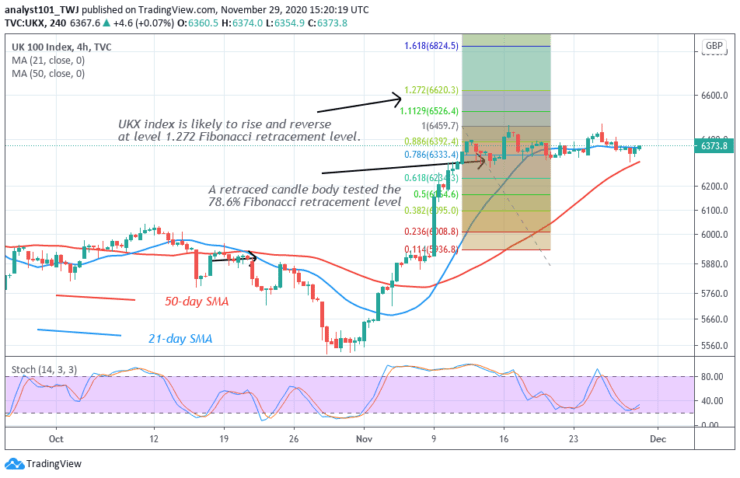
On the 4-hour chart, the share is in an upward move. However, the market is reaching the overbought region. On November 11 uptrend; a retraced candle body tested the 78.6% Fibonacci retracement level. This explains that the share is likely to reach level 1.272 Fibonacci extensions and reverse. That is the high of level 6620.30.
4-hour Chart Indicators Reading
The share is below the 40% range of the daily stochastic. It indicates that the market is in a bearish momentum. The 21-day and 50-day SMAs are sloping upward indicating the uptrend.
General Outlook for FTSE 100 (UKX)
FTSE 100 (UKX) share is presently rising but faces strong selling pressure at higher at a higher price level.The Fibonacci tool is indicating that the share has reached the overbought region of the market. The share is consolidating below level 6400.
Note: Learn2.Trade is not a financial advisor. Do your research before investing your funds in any financial asset or presented product or event. We are not responsible for your investing result
- Broker
- Min Deposit
- Score
- Visit Broker

- Award-winning Cryptocurrency trading platform
- $100 minimum deposit,
- FCA & Cysec regulated

- 20% welcome bonus of upto $10,000
- Minimum deposit $100
- Verify your account before the bonus is credited
- Fund Moneta Markets account with a minimum of $250
- Opt in using the form to claim your 50% deposit bonus
Learn to Trade
Never Miss A Trade Again

Signal Notification
Real-time signal notifications whenever a signal is opened, closes or Updated

Get Alerts
Immediate alerts to your email and mobile phone.

Entry Price Levels
Entry price level for every signal Just choose one of our Top Brokers in the list above to get all this free.