

FTSE 100 Analysis – January 22
FTSE 100 trend indicates a strong bullish momentum. The Relative Strength Index (RSI) is at 72.48, reflecting overbought conditions, which are common in strong bullish trends. The Fibonacci retracement levels show critical support, particularly at $8050 (61.8%) and $8130 (50%), while the price remains above these levels, indicating sustained bullish pressure. The 1.618 Fibonacci extension level at $7370 remains distant, signifying strong momentum holding the index away from deeper corrections.
FTSE 100 Key Levels
Resistance Levels: $8470, $8800, $9000
Support Levels: $8370, $8100, $7800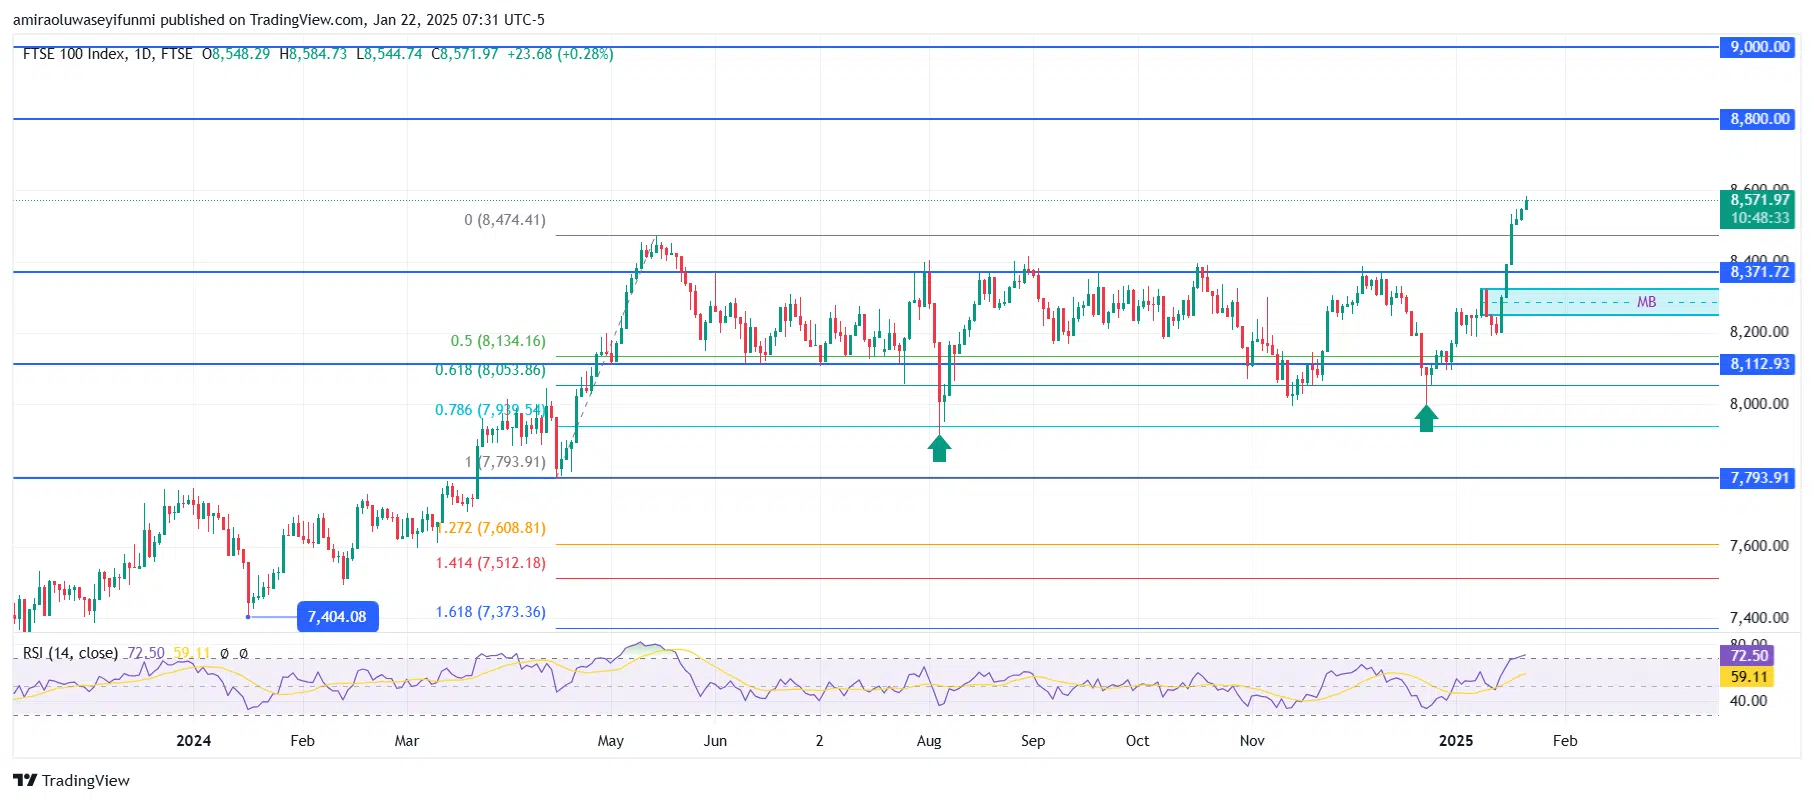
FTSE 100 Long-Term Trend: Bullish
Price action has broken past $8370, forming a new high at $8570. The move above this resistance confirms bullish dominance. Significant demand zones around $8110 provided support during pullbacks. The market structure break (MB) level around $8370 solidifies this as a potential support zone in the future.

FTSE 100 Short-Term Trend: Bullish
The FTSE 100 is showing strong bullish momentum, with the price firmly above the $8370 support zone and breaking out of the $8370 level. The RSI at 82.14 signals overbought conditions, yet the upward trajectory suggests continued strength in the market. The break of structure (BOS) confirms a shift in market sentiment toward sustained bullishness. A potential target lies at $8800, while $8370 serves as immediate support for retracements.
Make money without lifting your fingers: Start using a world-class auto trading solution
How To Buy Lucky Block
Note: Learn2.trade is not a financial advisor. Do your research before investing your funds in any financial asset, product, or event. We are not responsible for your investment results.


