FTSE 100 Analysis – October 8
FTSE 100 sustains its upward trajectory amid technical confirmation signals. The FTSE 100 Index maintains a strong bullish bias as price action remains above the 9-day Simple Moving Average (SMA) around $9,390, reflecting sustained market strength and investor optimism. The MACD indicator reinforces this momentum, with its histogram expanding in positive territory and the signal line trending upward, suggesting steady buying pressure and favorable risk appetite across the broader market. The prevailing structure highlights a continuation phase following a consolidation period, aligning with the wider bullish sentiment observed in global equity indices.
FTSE 100 Key Levels
Resistance Levels: $9,520, $9,700, $9,900
Support Levels: $9,350, $8,900, $8,480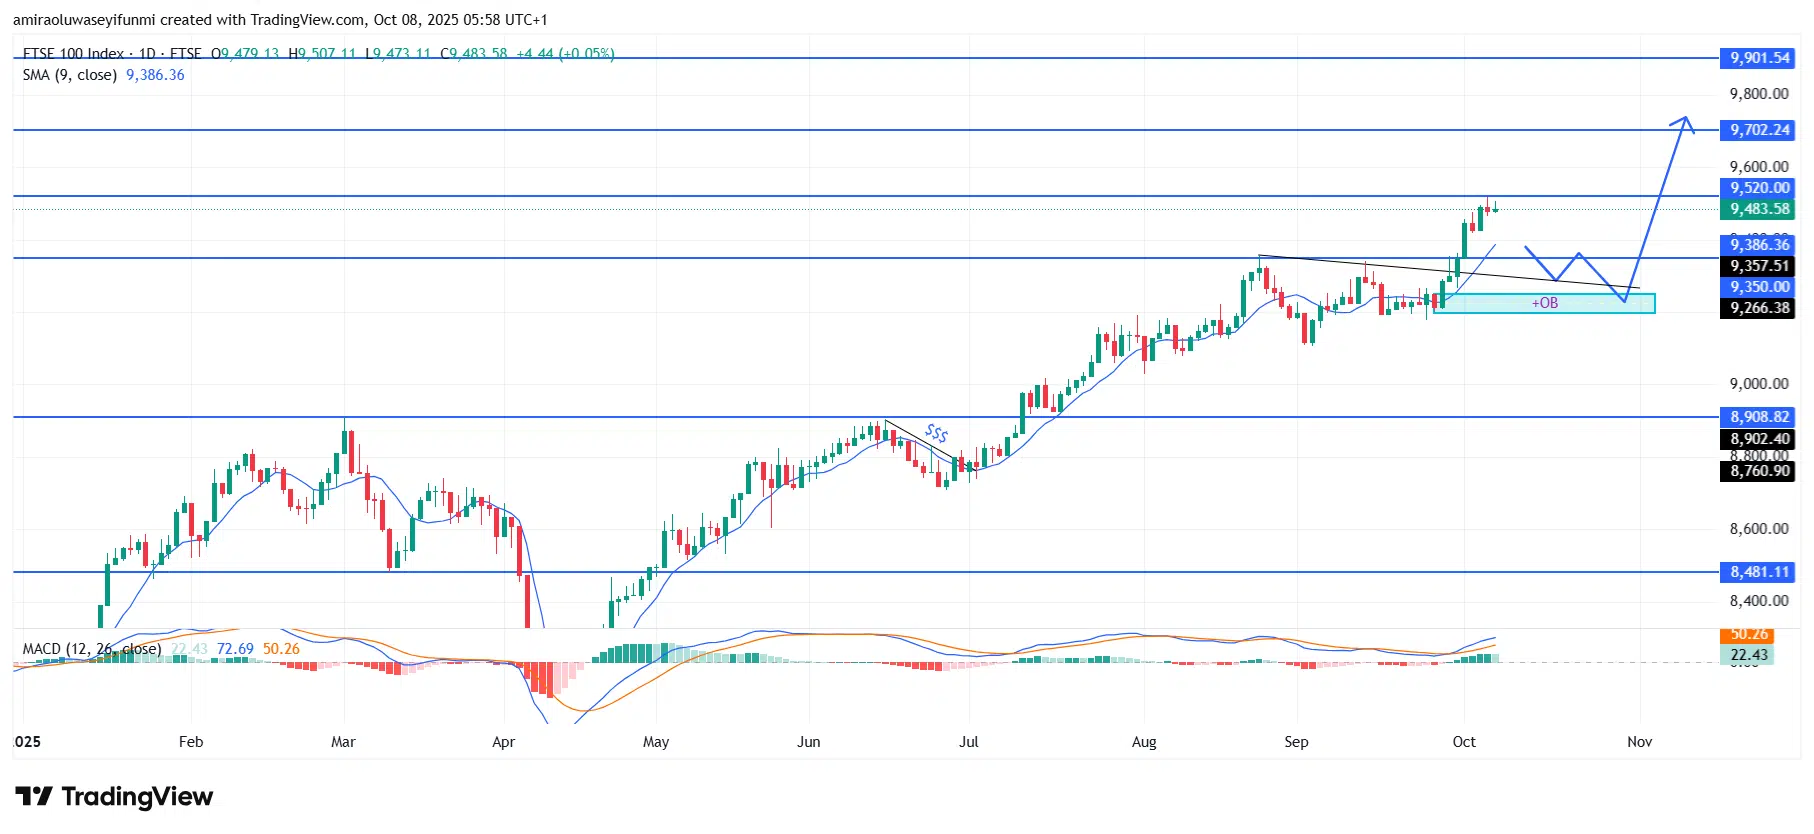
FTSE100 Long-Term Trend: Bullish
From a technical perspective, price has confirmed a breakout above the previous consolidation range between $9,350 and $9,390, signaling the continuation of its upward cycle. The recent retracement toward the $9,270–$9,350 demand zone represents a healthy correction, likely forming a reaccumulation base before the next upward phase. This area coincides with a bullish order block and former structural resistance now acting as support, reinforcing its technical relevance. Maintaining stability above this level is expected to preserve the overall bullish framework, with buyers continuing to dominate the market’s medium-term direction.
Looking ahead, price projections point to a potential move toward $9,700 as the next key resistance, followed by an extended target near $9,900 if momentum remains intact. A minor retracement into the $9,350 support region could precede further upside, allowing the market to gather liquidity before continuing its advance. As long as support above $9,270 holds, the bullish outlook remains valid, positioning the FTSE 100 for higher valuations through the fourth quarter, as highlighted in several expert forex signals.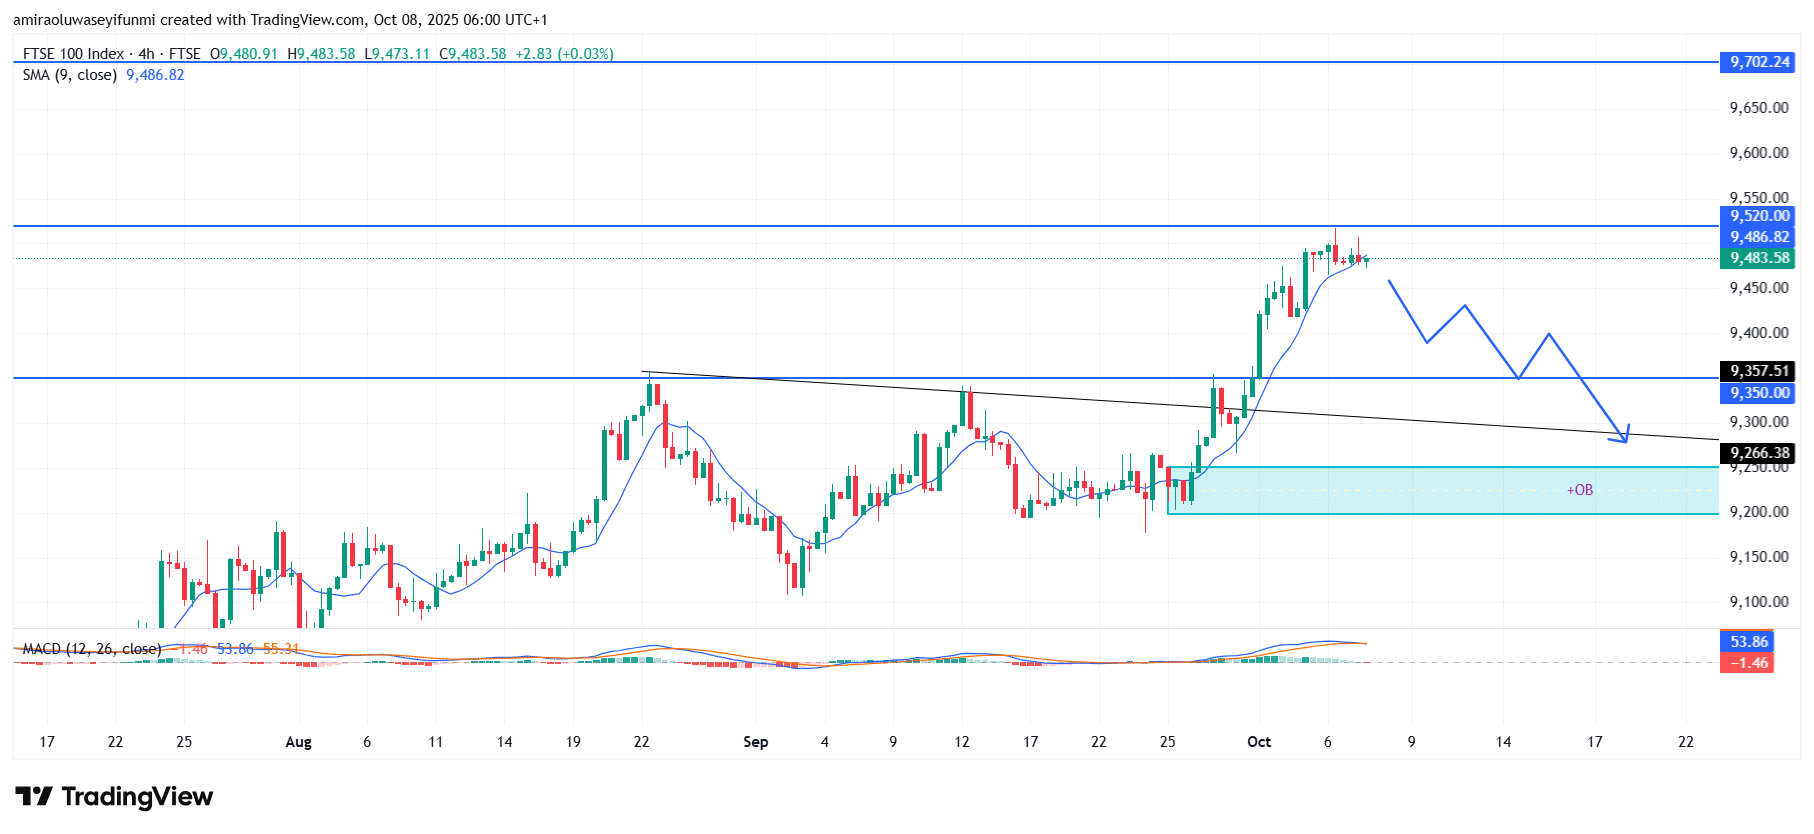
FTSE100 Short-Term Trend: Bearish
FTSE 100 is currently experiencing a short-term bearish retracement as price struggles to maintain strength above the $9,490 resistance zone. The market structure indicates mild exhaustion, with price likely to pull back toward the $9,350 support area.
A sustained move below this level could invite further downside pressure toward the $9,270 demand zone, aligning with the previously identified order block. The weakening MACD momentum supports this short-term corrective phase before renewed accumulation potentially drives another upward leg.
Make money without lifting your fingers: Start using a world-class auto trading solution
How To Buy Lucky Block
Note: Learn2.trade is not a financial advisor. Do your research before investing your funds in any financial asset, product, or event. We are not responsible for your investment results.
- Broker
- Min Deposit
- Score
- Visit Broker

- Award-winning Cryptocurrency trading platform
- $100 minimum deposit,
- FCA & Cysec regulated

- 20% welcome bonus of upto $10,000
- Minimum deposit $100
- Verify your account before the bonus is credited
- Fund Moneta Markets account with a minimum of $250
- Opt in using the form to claim your 50% deposit bonus
Learn to Trade
Never Miss A Trade Again

Signal Notification
Real-time signal notifications whenever a signal is opened, closes or Updated

Get Alerts
Immediate alerts to your email and mobile phone.

Entry Price Levels
Entry price level for every signal Just choose one of our Top Brokers in the list above to get all this free.