

FTSE 100 Analysis – May 28
FTSE 100 rejects resistance as downside pressure intensifies. From an indicator perspective, the Relative Strength Index (RSI) currently reads 62.3, a level that traditionally approaches overbought conditions. However, the RSI has recently begun to decline, indicating a slowdown in bullish momentum. The 9-day Simple Moving Average (SMA) is positioned around $8,690 and has served as a dynamic support level in recent weeks. A price drop below this level sends early signals of a potential bearish shift, especially if accompanied by continued RSI divergence or an inability to recover higher price levels.
FTSE 100 Key Levels
Resistance Levels: $8800, $9000, $9200
Support Levels: $8480, $8110, $7540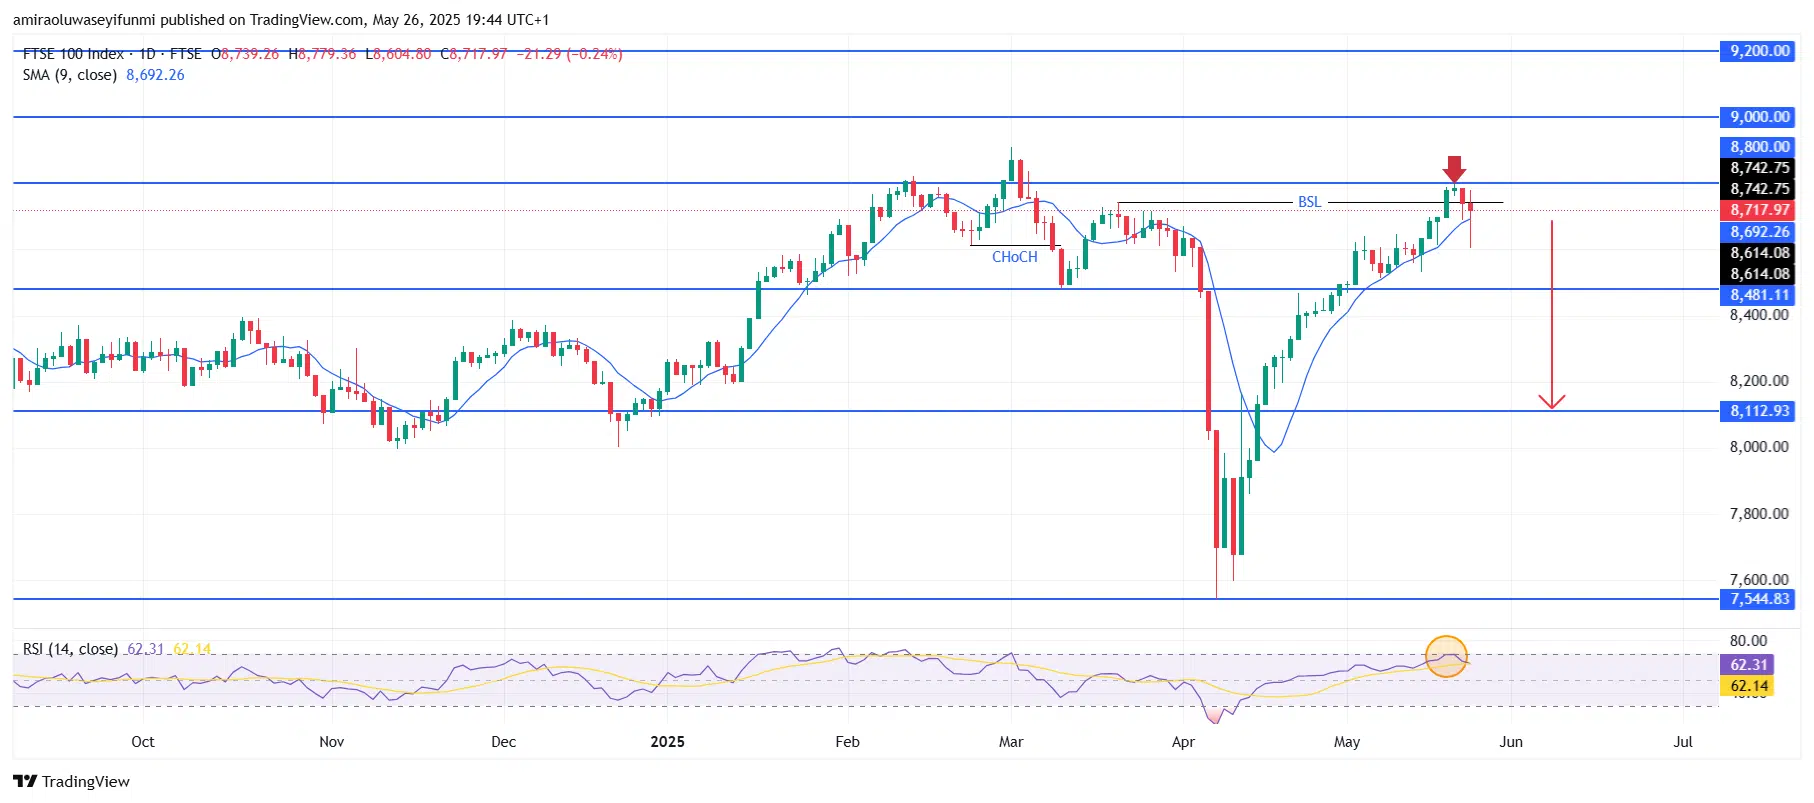
FTSE100 Long-Term Trend: Bearish
The chart pattern analysis shows that the FTSE 100 index has clearly rejected the $8,800 resistance level, as evidenced by the recent red candle with a noticeable upper wick. This took place shortly after a breakout above the Buy-Side Liquidity level near $8,740, hinting at a possible liquidity sweep prior to distribution. A Change of Character earlier this year around $8,480 set the stage for the prevailing volatility, and recent price action confirms rejection from a key supply zone.
The rejection at $8,800 strongly suggests that a bearish retracement is underway, with price likely to retest the intermediate support at $8,480 in the near future. If this level does not hold, further downside could reach the $8,110 area, which aligns with prior consolidation support. A break below this zone opens the possibility of a bearish target near $7,540. To invalidate this bearish scenario, the index would require a strong close above $8,800 supported by high trading volume and RSI confirmation above 70—a condition not currently reflected in market behavior.
FTSE100 Short-Term Trend: Bearish
FTSE 100 has rejected the $8,800 resistance level, creating a clear market structure shift to the downside. The price is now trading below the 9-period SMA at $8,750, indicating a decline in short-term bullish momentum.
The RSI has dropped from a peak of 65 to 55, highlighting decreasing buying pressure. A continued move below $8,610 could prompt additional losses toward $8,480 and potentially $8,110. Traders interpreting forex signals may see this as confirmation of sustained bearish sentiment, reinforcing short-term selling opportunities.
Make money without lifting your fingers: Start using a world-class auto trading solution
How To Buy Lucky Block – Guide, Tips & Insights | Learn 2 Trade
Note: Learn2.trade is not a financial advisor. Do your research before investing your funds in any financial asset, product, or event. We are not responsible for your investment results.
- Broker
- Min Deposit
- Score
- Visit Broker

- Award-winning Cryptocurrency trading platform
- $100 minimum deposit,
- FCA & Cysec regulated

- 20% welcome bonus of upto $10,000
- Minimum deposit $100
- Verify your account before the bonus is credited


- Fund Moneta Markets account with a minimum of $250
- Opt in using the form to claim your 50% deposit bonus


