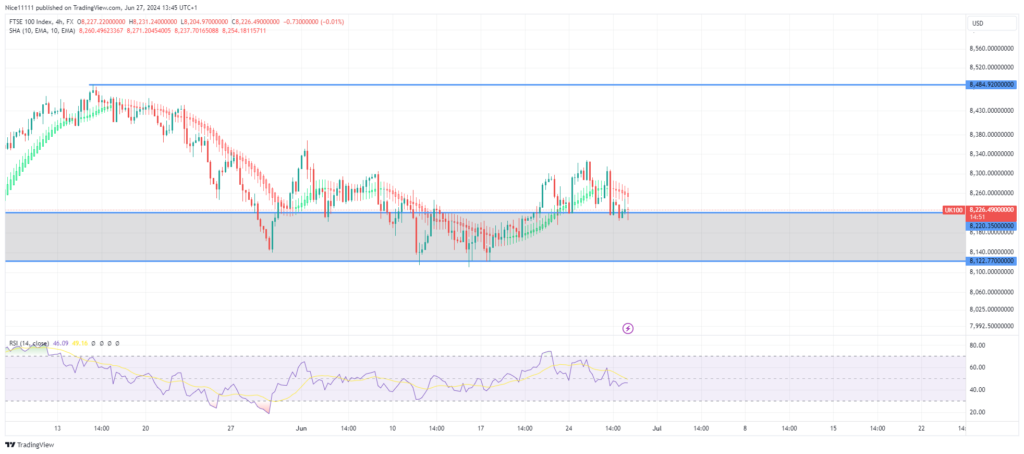
The FTSE 100 reached a peak of 8484.0 before buyer exhaustion led to a pullback to the bullish order block on the daily chart. Following this pullback, the price has spent a prolonged period in consolidation, forming a range.
The FTSE 100 has shown remarkable bullish momentum this year. The Relative Strength Index (RSI) indicated an overbought condition at the 8484.0 level, prompting a price decline. Smaller candles appeared at 8484.0 in early May, signaling the start of this decline.
The price subsequently fell below the Smoothed Heikin Ashi Candles, indicating a loss of bullish momentum, and pulled back to the demand zone at 8220.0. Currently, the RSI oscillator is at the midpoint, reflecting the consolidation at this demand level.
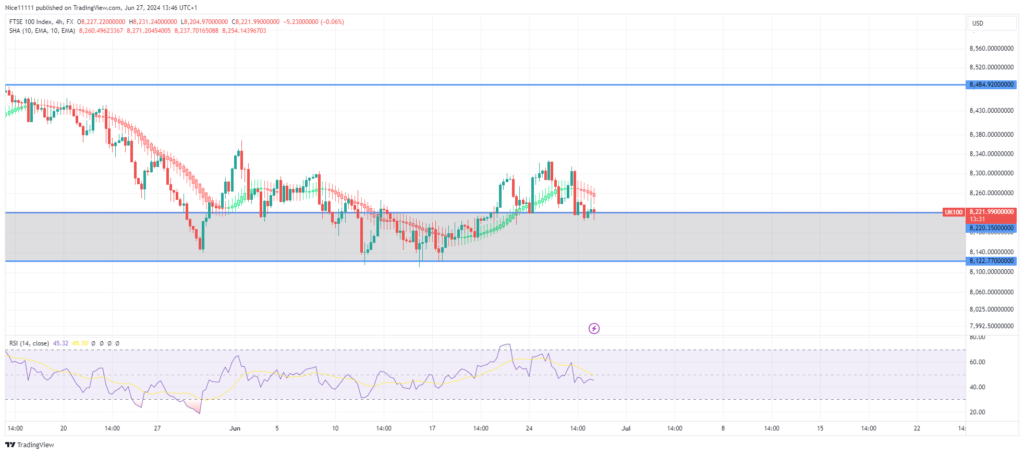
FTSE 100 Short-Term Trend: Ranging
On lower timeframes, the market structure is rough, lacking a consistent pattern of highs and lows. This suggests a reaccumulation phase, which may generate energy for a bullish displacement. Accurate forex signals target the next swing high at 8484.0, which seems to be a reachable short-term objective. This target is considered achievable given the current market conditions. The FTSE 100’s resilience at these levels indicates strong underlying demand, with potential for further bullish movements once the consolidation phase concludes.
Note: Learn2.trade is not a financial advisor. Do your research before investing your funds in any financial asset, product, or event. We are not responsible for your investment results.
Trade on MT4 with Leverage up to 1:500! Trade on MT4 with Leverage up to 1:500!
X
We use cookies to ensure that we give you the best experience on our website. If you continue to use this site we will assume that you are happy with it.