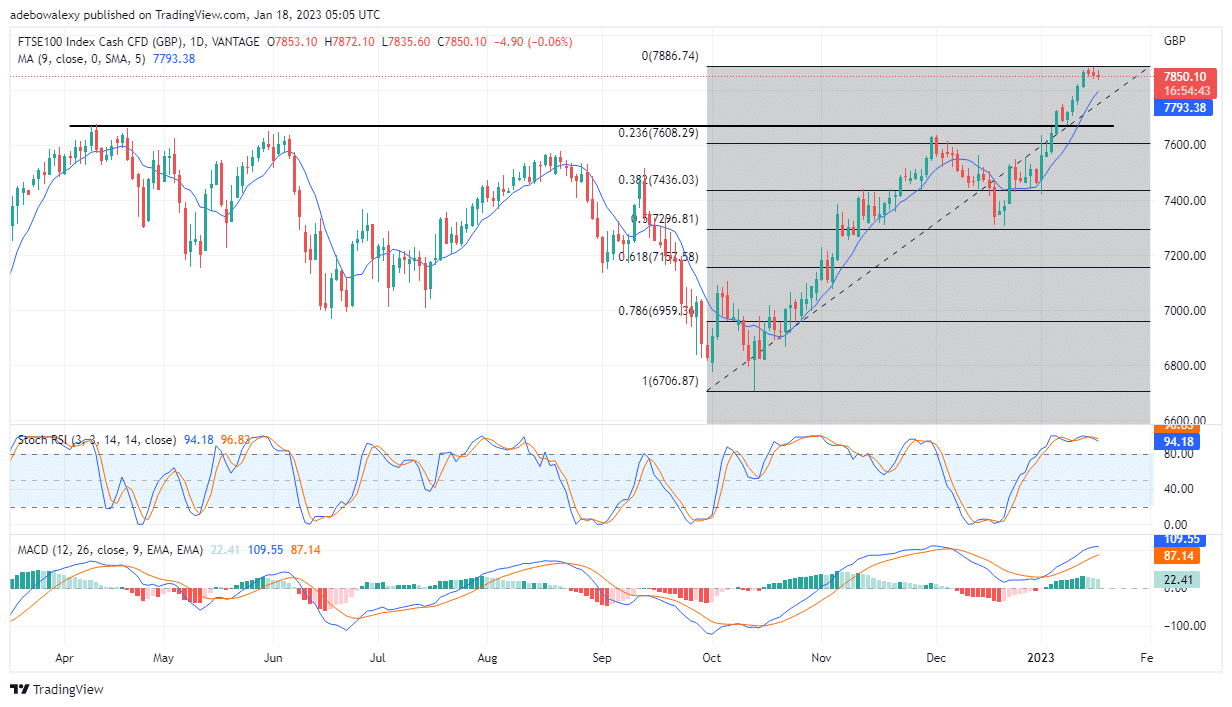
The FTSE 100 market stayed consistent with gains from early January until last Thursday. This performance has seen price action in this market break a long-standing resistance at $7,680. However, it appears that market bulls are getting exhausted, as price action in this market seems bearish at the moment.
Major Price Levels:
Top Levels: $7,870, $7,900, $7,930
Floor Levels: $7,850, $7,820, $7,790

FTSE 100 May Regain Upside Traction
Right from the start of January until last Thursday, the FTSE 100 price rose significantly enough to break a long-term resistance of $7,680. But at this point, this market is retracing lower price levels, which has caused prices to dip to $7,850. Nevertheless, the Stochastic RSI lines are still in the overbought region. However, these lines are now steadily making their way downwards towards the 90 mark of the indicator. Also, the lines of the MACD indicator are still above the equilibrium point at the 109 and 97 marks. But, it is important to know that the histogram bar of the MACD above the 0.00 mark, is now indicating a lack of momentum. This could be seen as these bars are now pale green. And, going by indicator signs here, we may witness prices falling lower in this market.

FTSE 100 Price Action Displays Maintains Minimal Bearish Potentials
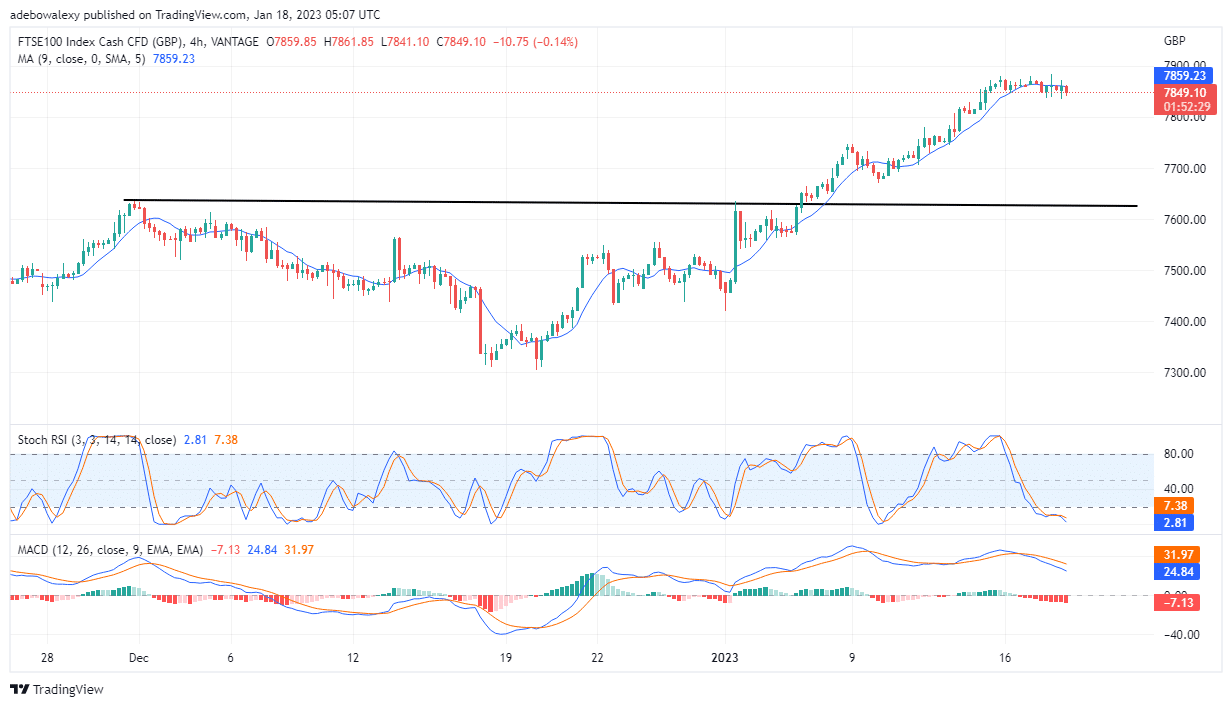
Price activities on the FTSE 100 4-hour market stay consistent with its minimally bearish characteristics. The last price candle on this chart is a bearish one, and though it only has a bigger body than its previous bullish counterpart which represents the previous trading session, it has pushed the price lower to $7,849. The current FTSE 100 price is now below the 9-day MA line, and this seems to be hinting at the possibility of further price decreases. But even at this small dip in price, the RSI curve has already reached deep into the oversold zone at roughly 7 and 2 levels of the indicator. Likewise, the MACD lines are still above the equilibrium level at the 32 and 25 marks, but its histogram bars have grown significantly below the equilibrium level. Consequently, it appears as if technical indicators here are hypersensitive. Consequently, this may be revealing that the price may not fall too far from here, perhaps to around $7,820.
Do you want to take your trading to the next level? Join the best platform for that here.
- Broker
- Min Deposit
- Score
- Visit Broker
- Award-winning Cryptocurrency trading platform
- $100 minimum deposit,
- FCA & Cysec regulated
- 20% welcome bonus of upto $10,000
- Minimum deposit $100
- Verify your account before the bonus is credited
- Fund Moneta Markets account with a minimum of $250
- Opt in using the form to claim your 50% deposit bonus
Learn to Trade
Never Miss A Trade Again

Signal Notification
Real-time signal notifications whenever a signal is opened, closes or Updated

Get Alerts
Immediate alerts to your email and mobile phone.

Entry Price Levels
Entry price level for every signal Just choose one of our Top Brokers in the list above to get all this free.


