

FTSE 100 Analysis – January 28
The FTSE 100 market maintains a bullish structure with a strong uptrend bias. The FTSE 100 continues to display a constructive upward trajectory, with trend-following indicators broadly aligned in support of further gains. Price remains comfortably above the short-term moving average around $10,170, reinforcing positive momentum conditions despite mild near-term consolidation. The broader indicator configuration suggests that bullish participation remains intact, as momentum has moderated without shifting into outright bearish territory, a characteristic commonly associated with healthy trends rather than reversals.
FTSE 100 Key Levels
Supply Levels: $10100, $10,400, $10,600
Demand Levels: $9900, $9700, $9350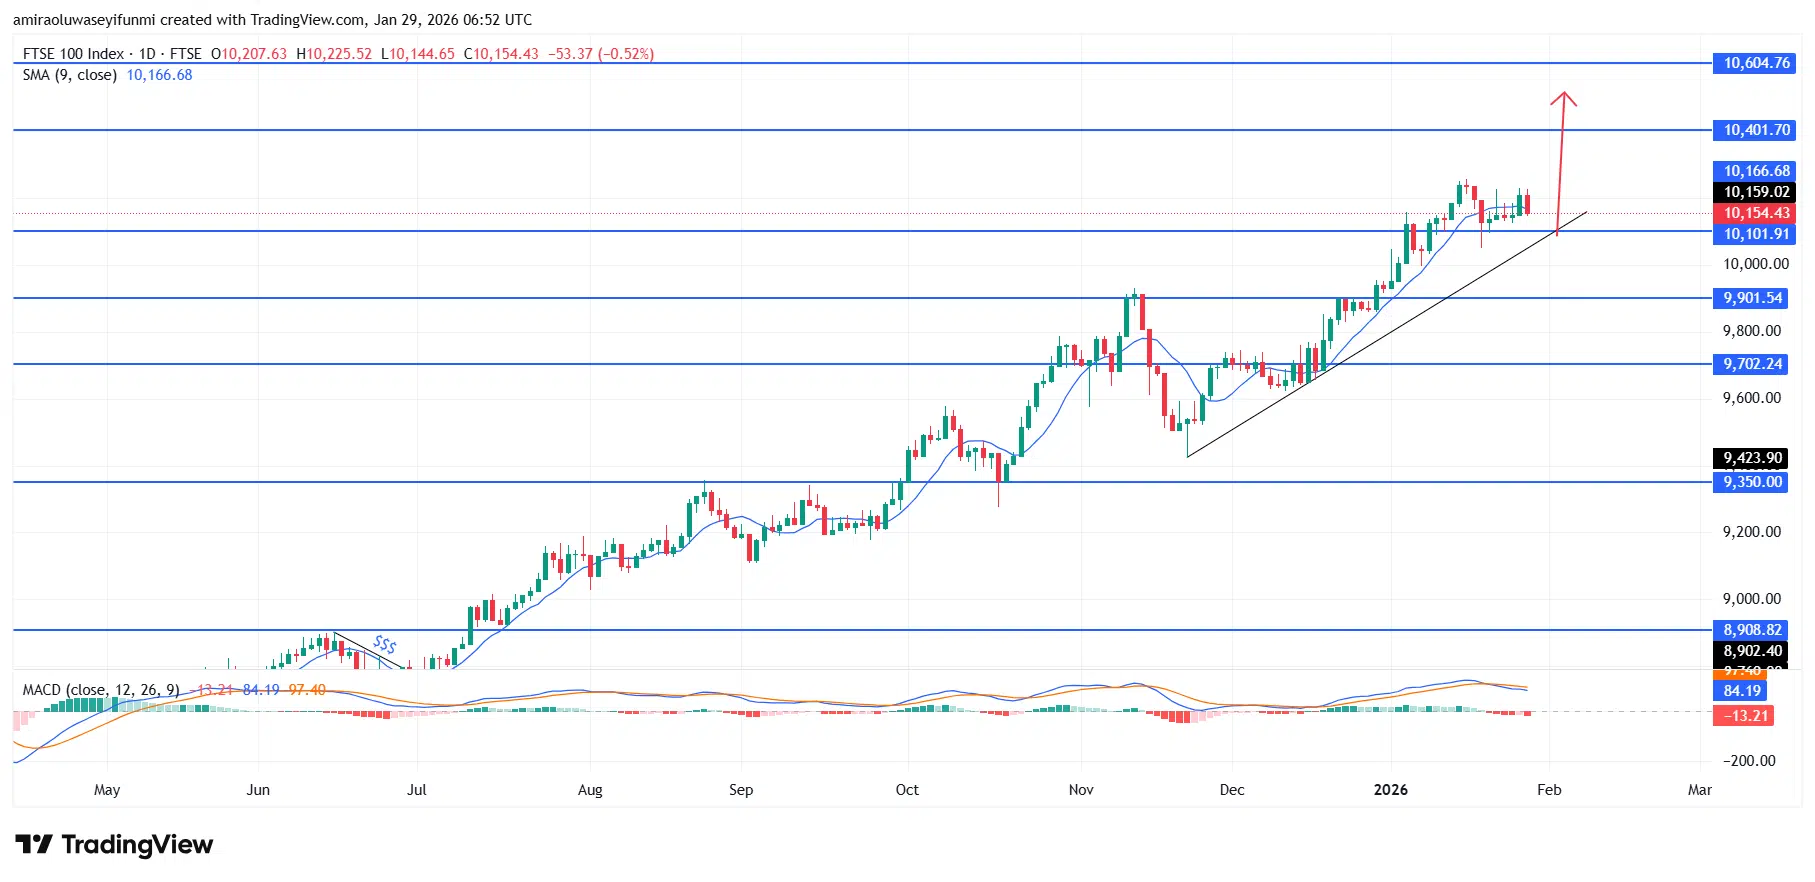
FTSE100 Long-Term Trend: Bullish
From a price-action perspective, the index continues to respect an ascending support structure, with higher lows developing from the $9,700 region through to approximately $10,100. Recent candles show compression above former resistance near $10,150, signaling acceptance above this level rather than rejection. Pullbacks toward trend support have remained orderly and shallow, reflecting sustained demand and a lack of aggressive distribution even as price engages upper resistance zones.
Looking ahead, continuation of this structure favors an upside resolution, with a measured advance toward the $10,400 region as the initial objective. A decisive daily close above this level would likely open scope for extension toward $10,600, aligning with the broader trend channel. Downside risk remains contained above $10,000, and unless price breaks below this threshold with momentum, the prevailing outlook continues to support trend continuation rather than exhaustion.
FTSE100 Short-Term Trend: Bullish
On the four-hour chart, the FTSE 100 maintains a bullish bias, with price holding above the rising trendline and stabilizing around the $10,150 area. The index continues to respect higher-low formations, while the short-term moving average near $10,170 functions as dynamic support rather than resistance. Consolidation above the $10,100 zone points to accumulation instead of weakness, indicating that buyers remain in control of the market structure, a setup that aligns with broader expectations often reflected in forex signals.
Make money without lifting your fingers: Start using a world-class auto trading solution
How To Buy Lucky Block
Note: Learn2.trade is not a financial advisor. Do your research before investing your funds in any financial asset, product, or event. We are not responsible for your investment results.


