

FTSE 100 Analysis – January 21
FTSE 100 index buyers stay as prices push upward in their favour. The FTSE 100 continues to trade firmly above the rising short-term moving average near $10,160, preserving positive directional alignment within a structurally supportive environment. Momentum conditions remain constructive, with the MACD maintaining a stable histogram above the zero line, reflecting sustained demand rather than late-stage excess. Buyer control throughout the recent price cycle is further reinforced by the prevailing sequence of higher highs and higher lows.
FTSE 100 Key Levels
Supply Levels: $10100, $10,400, $10,600
Demand Levels: $9900, $9700, $9350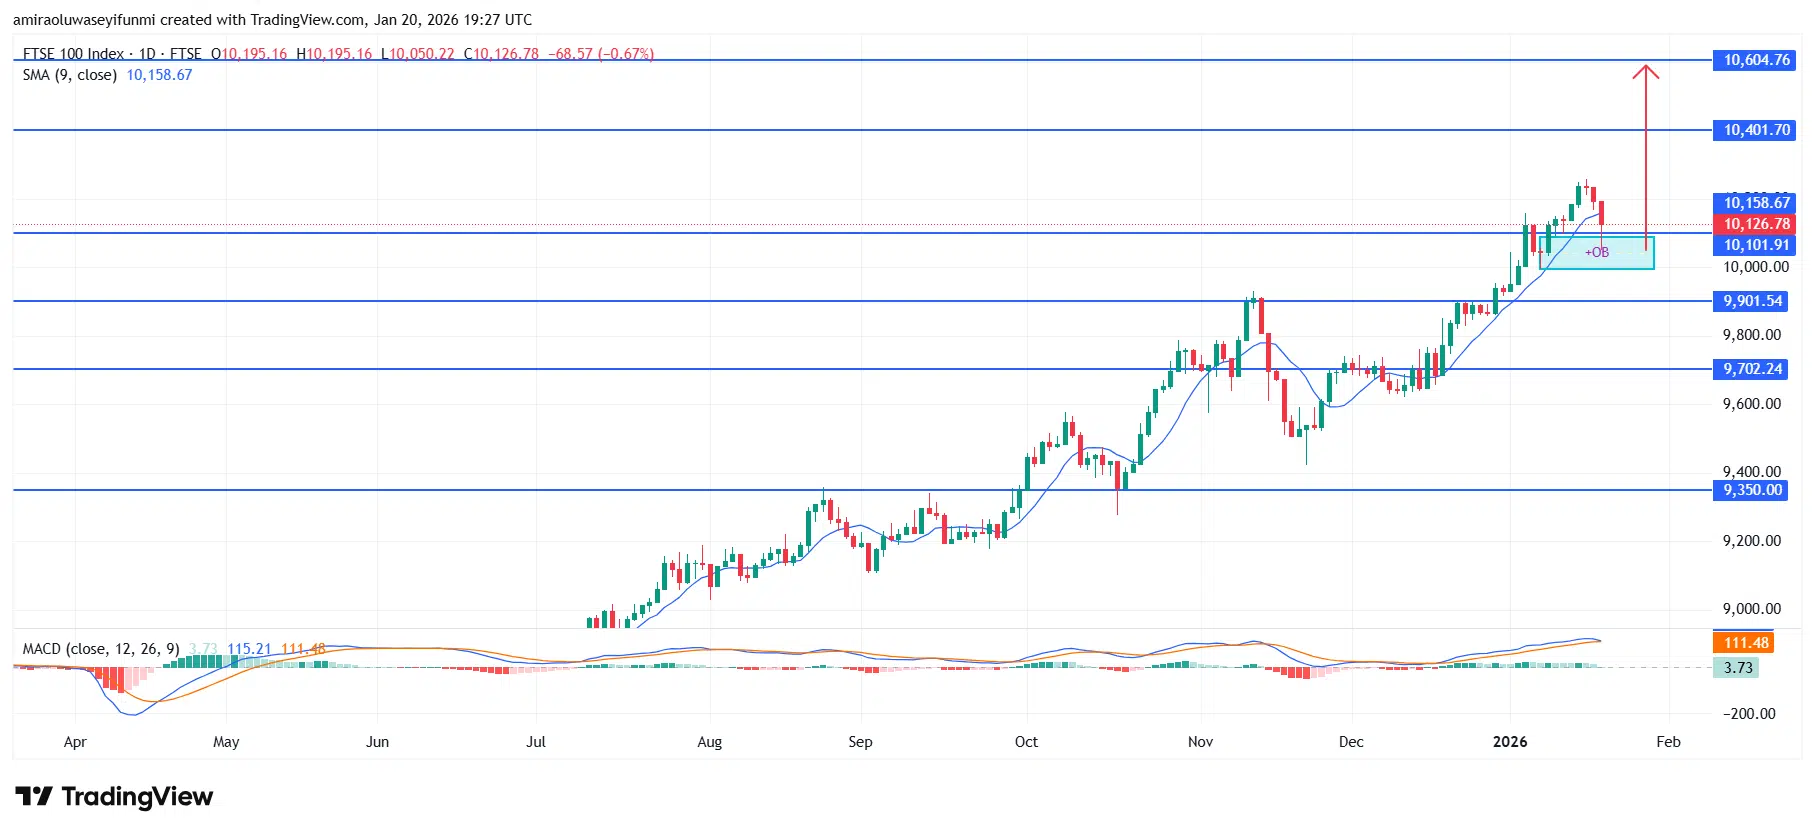
FTSE100 Long-Term Trend: Bullish
The index is currently treating the former breakout zone around $10,100 as a dependable demand base after successfully defending this level. The most recent corrective phase unfolded above key support without meaningful supply-driven follow-through, remaining orderly and contained. From a technical perspective, the broader bullish structure remains intact as long as price continues to hold above the $9,900 threshold.
Looking ahead, sustained acceptance above $10,100 keeps the pathway open toward $10,400, with potential for gradual extension into the $10,600 region if momentum strengthens further. Within the prevailing trend, interim pullbacks toward the $10,000–$9,900 zone are likely to attract renewed buying interest, aligning with broader forex signals that favor continuation. Unless a decisive breakdown undermines current support, the overall technical environment continues to support upside progression.
FTSE100 Short-Term Trend: Bullish
FTSE 100 maintains a bullish structure on the four-hour chart, with price holding above the rising trendline and stabilizing above the 9-period moving average. The recent pullback appears corrective in nature, as buyers continue to defend the highlighted demand zone near $10,090–$10,120, preserving the formation of higher lows.
Momentum remains broadly supportive despite a mild MACD cooldown, pointing to consolidation rather than trend reversal. A sustained hold above this base keeps upside pressure intact, with scope for continuation toward the $10,400 and $10,600 resistance levels.
Make money without lifting your fingers: Start using a world-class auto trading solution
How To Buy Lucky Block
Note: Learn2.trade is not a financial advisor. Do your research before investing your funds in any financial asset, product, or event. We are not responsible for your investment results.


