

FTSE 100 Analysis – June 25
FTSE 100 is showing structural weakness below a critical order block resistance. The index has recently lost bullish momentum, suggesting early signs of a bearish reversal after its sustained climb from the Q1 2025 low. The 9-day Simple Moving Average (SMA), currently around $8,820, has shifted from a support level to a resistance zone as the price dips below it. Meanwhile, the Relative Strength Index (RSI) has declined from above 62.00 to around 50.00, indicating a significant drop in buying pressure and nearing bearish territory. The combination of fading momentum and the breach of the SMA highlights weakening bullish sentiment and points to a potential shift in market direction.
FTSE 100 Key Levels
Resistance Levels: $8,900, $9,000, $9,200
Support Levels: $8,480, $8,110, $7,540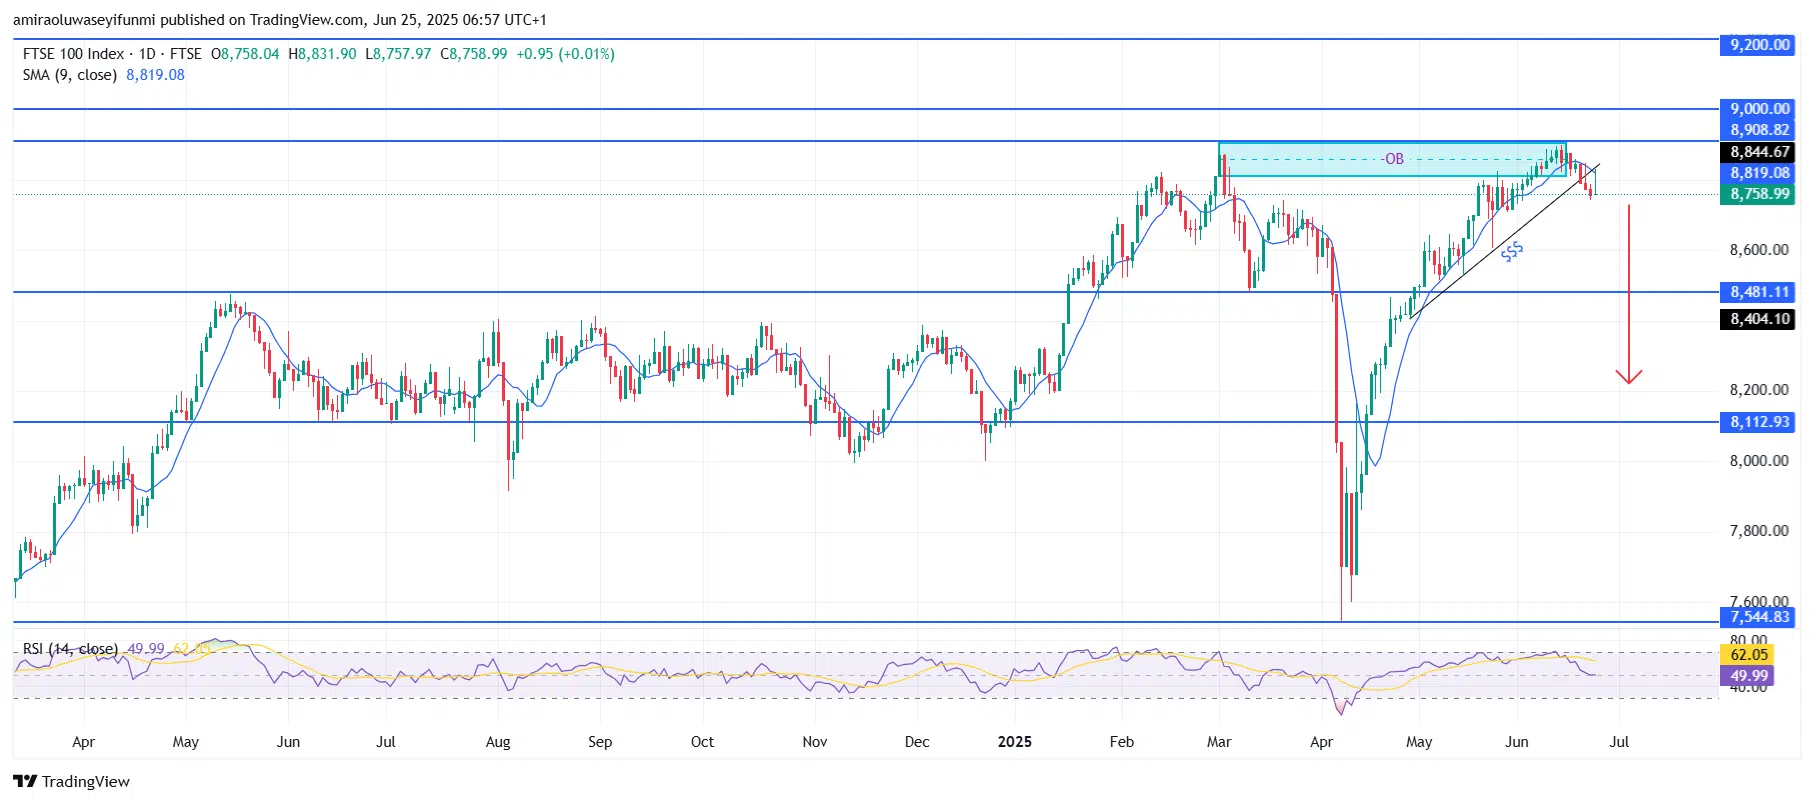
FTSE 100 Long-Term Trend: Bearish
The index recently failed to maintain gains above the $8,850–$8,910 order block, leading to a firm rejection at the $8,910 local high. This zone, recognized as an institutional supply area, has now established itself as strong resistance. A break of structure (BoS) is evident through the failure of the ascending trendline, further confirming the bearish tilt in the short-term market behavior. Sellers appear to be gaining dominance, as seen in the formation of lower highs and increasingly bearish candlestick bodies. The bulls’ inability to regain control at this key resistance serves as a strong bearish confirmation.
Looking ahead, FTSE 100 is likely to face a deeper retracement, with the next critical demand level near $8,480. A clear breakdown below this level could expose the index to further downside risk, targeting the $8,110 zone, which marks a previous accumulation area. Should this level also fail, a retest of the $7,540 macro support is plausible. Any meaningful bullish recovery would require a strong move back above $8,900, supported by significant volume, to counter this bearish perspective and potentially align with forex signals suggesting a shift.
FTSE 100 Short-Term Trend: Bearish
FTSE 100 has dropped below its ascending trendline and now trades under the 9-period SMA, confirming bearish momentum on the four-hour chart. The price faced a strong rejection from the $8,910–$8,845 order block, with a lower high now established below this resistance zone.
Make money without lifting your fingers: Start using a world-class auto trading solution
How To Buy Lucky Block – Guide, Tips & Insights | Learn 2 Trade
Note: Learn2.trade is not a financial advisor. Do your research before investing your funds in any financial asset, product, or event. We are not responsible for your investment results.
- Broker
- Min Deposit
- Score
- Visit Broker

- Award-winning Cryptocurrency trading platform
- $100 minimum deposit,
- FCA & Cysec regulated

- 20% welcome bonus of upto $10,000
- Minimum deposit $100
- Verify your account before the bonus is credited


- Fund Moneta Markets account with a minimum of $250
- Opt in using the form to claim your 50% deposit bonus


