FTSE 100 Analysis – May 14
FTSE 100 displays early signs of a potential bearish reversal. The 9-day Simple Moving Average (SMA), currently positioned around $8,570, acts as dynamic support, though the price appears to be losing momentum above it. The Relative Strength Index (RSI) is trending just below the 61 mark, indicating weakening bullish strength and a potential overextension without clear signs of continued upward movement. The recent downturn in the RSI signals a possible shift in sentiment, as it edges toward the overbought zone without solid momentum. This loss in strength supports a more cautious view of near-term price action.
FTSE 100 Key Levels
Resistance Levels: $8,800, $9,000, $9,200
Support Levels: $8,480, $8,110, $7,540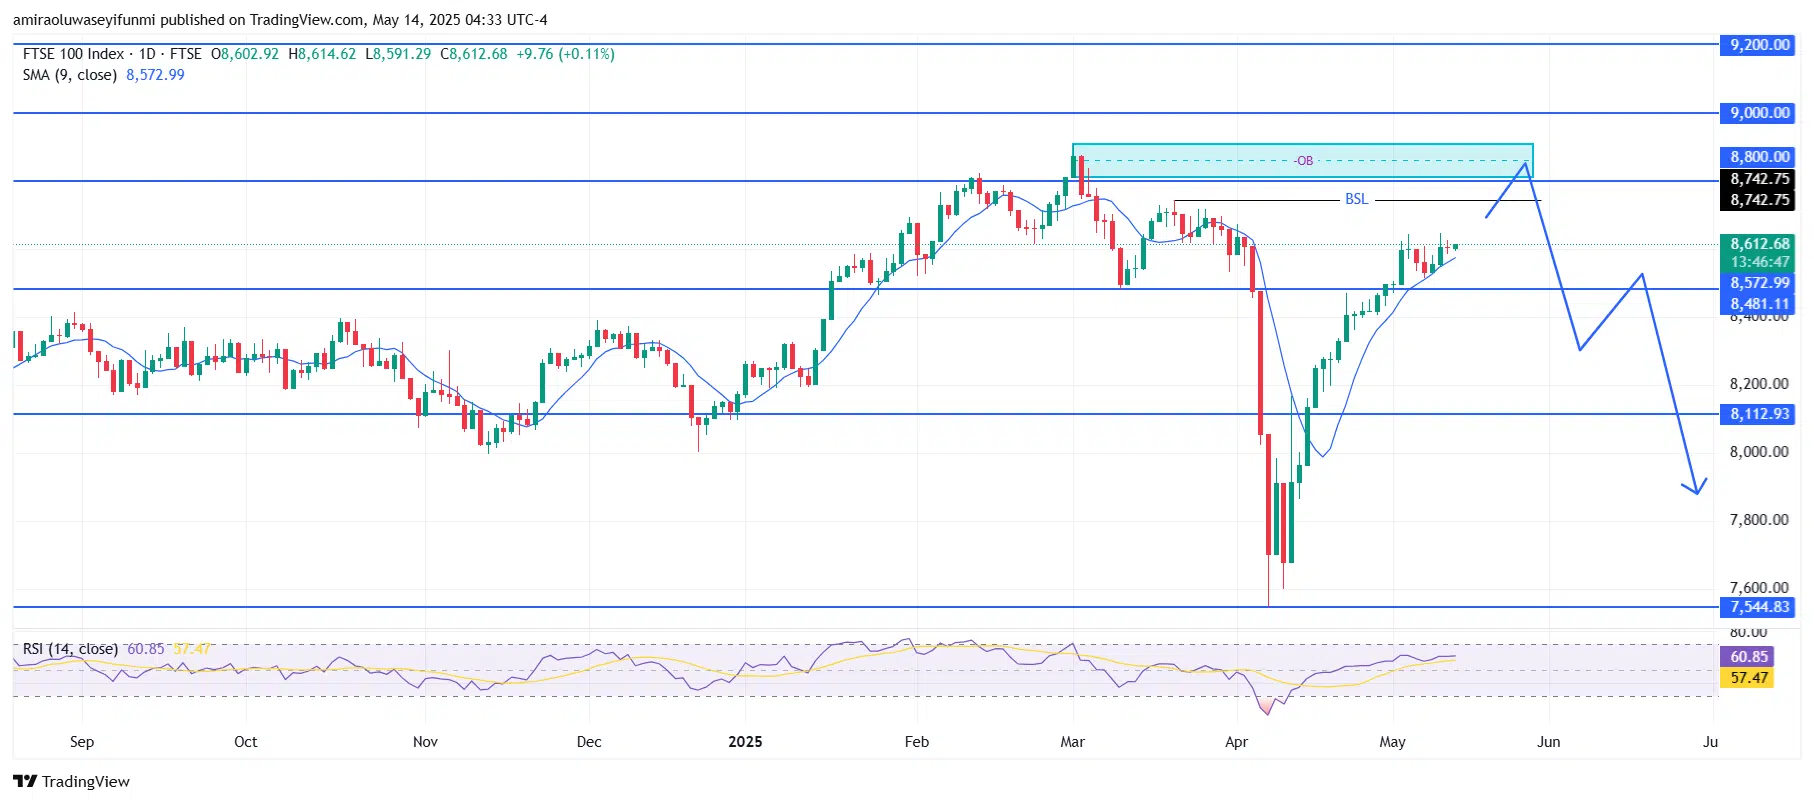
FTSE 100 Long-Term Trend: Bearish
FTSE 100 is on track to retest the $8,740 level as it approaches a previous high near $8,480. Price action may establish a lower high within the $8,800–$8,880 supply zone, which overlaps with an earlier order block responsible for initiating a selloff. A potential bull trap appears to be forming just beneath the resistance area, reinforcing bearish sentiment.
Looking forward, the market may complete a sweep of the $8,800 level before reversing downward toward $8,480, and possibly $8,110. A decisive break below $8,110 could pave the way for deeper declines toward the $7,550 support region. This projected path suggests a short-term fakeout above recent highs before a stronger bearish phase emerges. While the current price action might seem stable, broader indicators, including many forex signals, point to increased downside risk.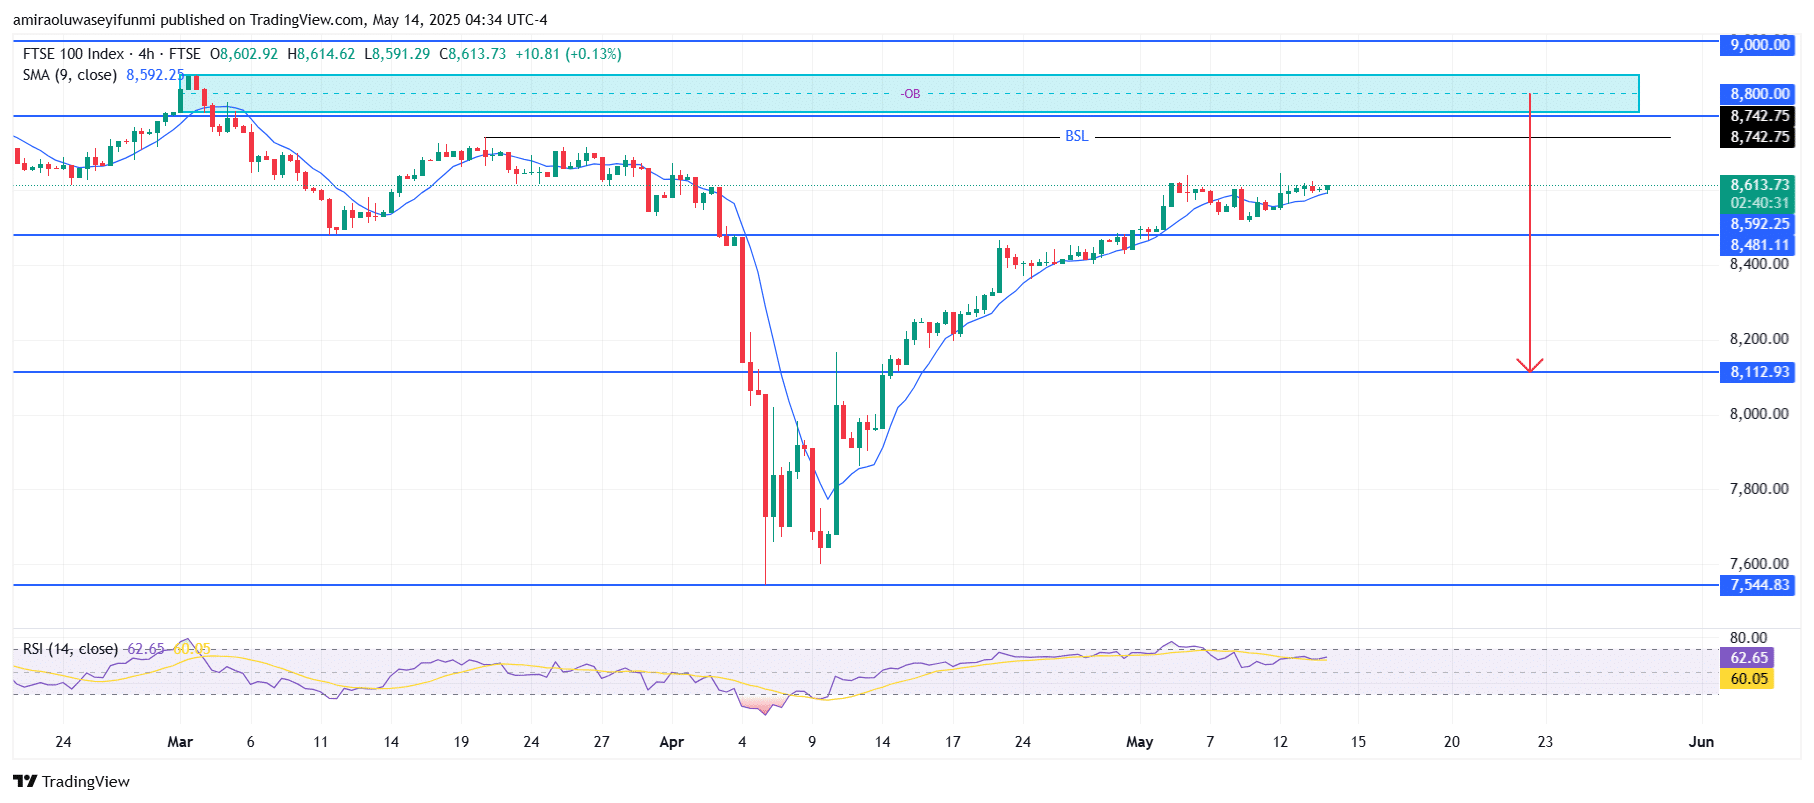
FTSE 100 Short-Term Trend: Bearish
The overall order flow on the four-hour chart remains bullish. However, the price is nearing a significant supply zone at $8,800. A rejection after a buy-side liquidity grab above the $8,740 swing high could lead to a sharp decline.
Make money without lifting your fingers: Start using a world-class auto trading solution
How To Buy Lucky Block – Guide, Tips & Insights | Learn 2 Trade
Note: Learn2.trade is not a financial advisor. Do your research before investing your funds in any financial asset, product, or event. We are not responsible for your investment results.
- Broker
- Min Deposit
- Score
- Visit Broker

- Award-winning Cryptocurrency trading platform
- $100 minimum deposit,
- FCA & Cysec regulated

- 20% welcome bonus of upto $10,000
- Minimum deposit $100
- Verify your account before the bonus is credited
- Fund Moneta Markets account with a minimum of $250
- Opt in using the form to claim your 50% deposit bonus
Learn to Trade
Never Miss A Trade Again

Signal Notification
Real-time signal notifications whenever a signal is opened, closes or Updated

Get Alerts
Immediate alerts to your email and mobile phone.

Entry Price Levels
Entry price level for every signal Just choose one of our Top Brokers in the list above to get all this free.