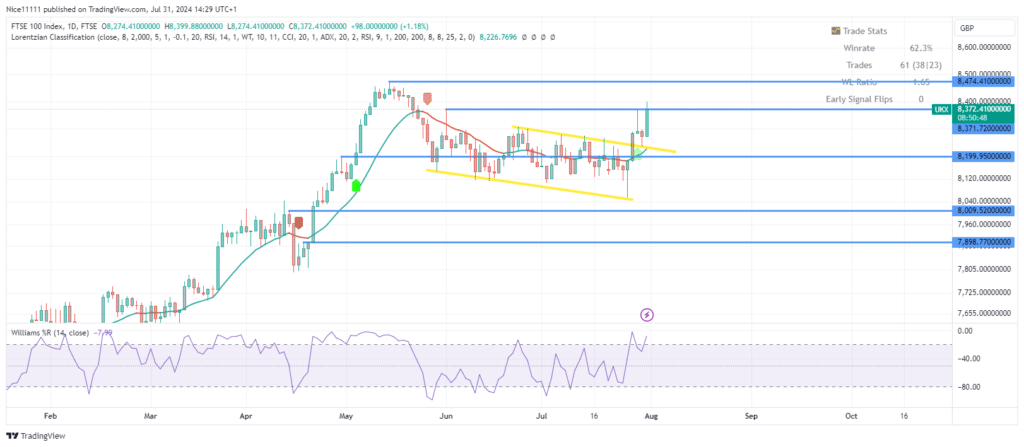
The FTSE 100 index has experienced a bullish breakout from a parallel channel on the daily chart. The price pulled back to retest the border of the parallel channel, which provided support to propel it beyond the swing high of 8371.0.
The FTSE 100 breakout was preceded by a test of the supporting border of the parallel channel, marked by a hammer candle. This hammer candle signaled a strong takeoff.
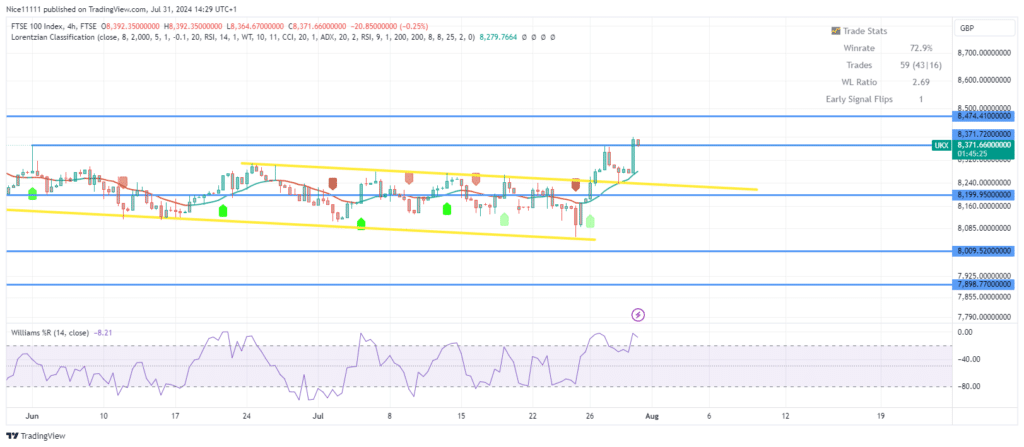
The breakout led to 8371.0, a level that proved to be very sensitive. In June, a swing high formed at this price, halting a bullish retracement and indicating resistance. The price dipped quickly in reaction but was supported by the bearish trendline. Upon retesting the channel, the Machine Learning Lorentizan Classification Indicator produced a buy signal.
FTSE 100 Short-Term Trend: Bullish
A bullish order block lies below the swing high of 8371.0, offering a good setup for bullish signals. The breakout above 8371.0 has established a bullish structure, expected to propel the price to 8474.0. Using forex signals can help traders capitalize on these movements effectively.
Note: Learn2.trade is not a financial advisor. Do your research before investing your funds in any financial asset, product, or event. We are not responsible for your investment results.
Trade on MT4 with Leverage up to 1:500! Trade on MT4 with Leverage up to 1:500!
X
We use cookies to ensure that we give you the best experience on our website. If you continue to use this site we will assume that you are happy with it.

 FTSE 100 Short-Term Trend: Bullish


