FTSE 100 Analysis – April 16
FTSE 100 is nearing a key resistance level amidst a significant pullback. On the daily timeframe, early signs of bearish momentum are emerging, as reflected in the indicators. The 9-day Simple Moving Average (SMA) has begun to flatten around $7,980, following the recent strong upward retracement. At the same time, the MACD (Moving Average Convergence Divergence) remains below the signal line, accompanied by a negative histogram reading of -3.72. Both MACD lines are currently trending downward, indicating bearish divergence despite the temporary recovery. This suggests that the bullish momentum is weakening and a continuation of the downward trend is likely once the price tests key resistance.
FTSE 100 Key Levels
Resistance Levels: $8,480, $8,800, $9,000
Support Levels: $8,110, $7,790, $7,540
FTSE 100 Long-Term Trend: Bullish
The index previously experienced a sharp decline following a Break of Structure (BOS) around $8,480, which was succeeded by a rally that now appears to be approaching a bearish order block between approximately $8,480 and $8,610. This zone overlaps with previous support, where a Change of Character (CHoCH) also took place. The current price, around $8,220, is moving into this order block with a corrective structure, indicating potential resistance within this highlighted area. Past consolidation between $8,370 and $8,480 further reinforces this supply zone.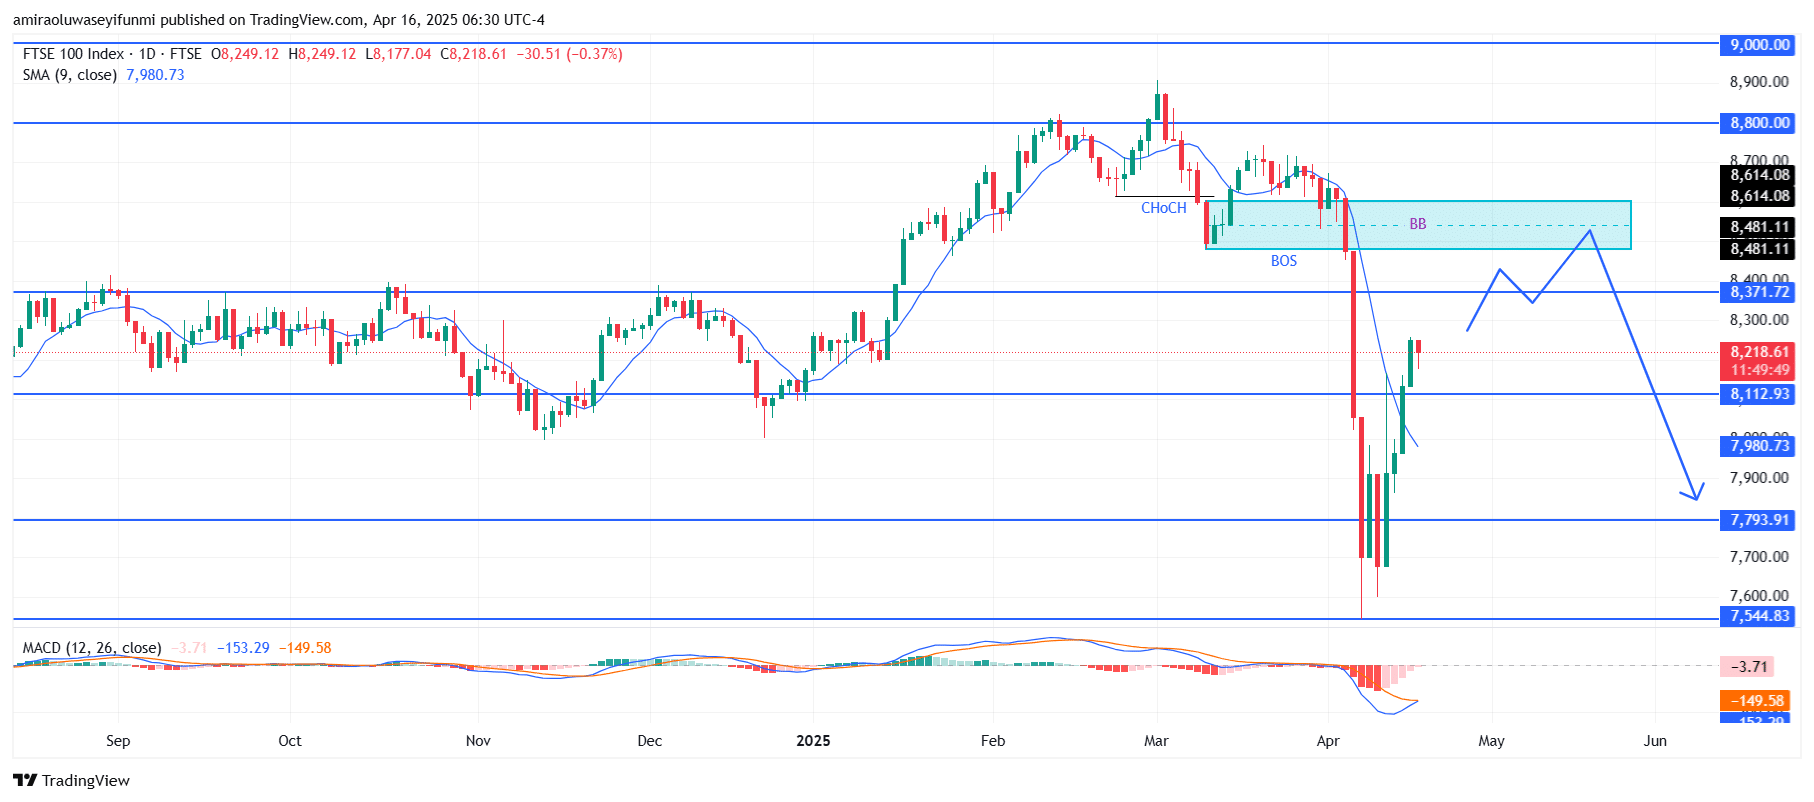
FTSE 100 Short-Term Trend: Bullish
FTSE 100 is displaying bullish momentum on the 4-hour chart, following a strong bounce from the $7,550 region. The MACD histogram is climbing, and both MACD lines have crossed above the signal line, confirming short-term bullish strength.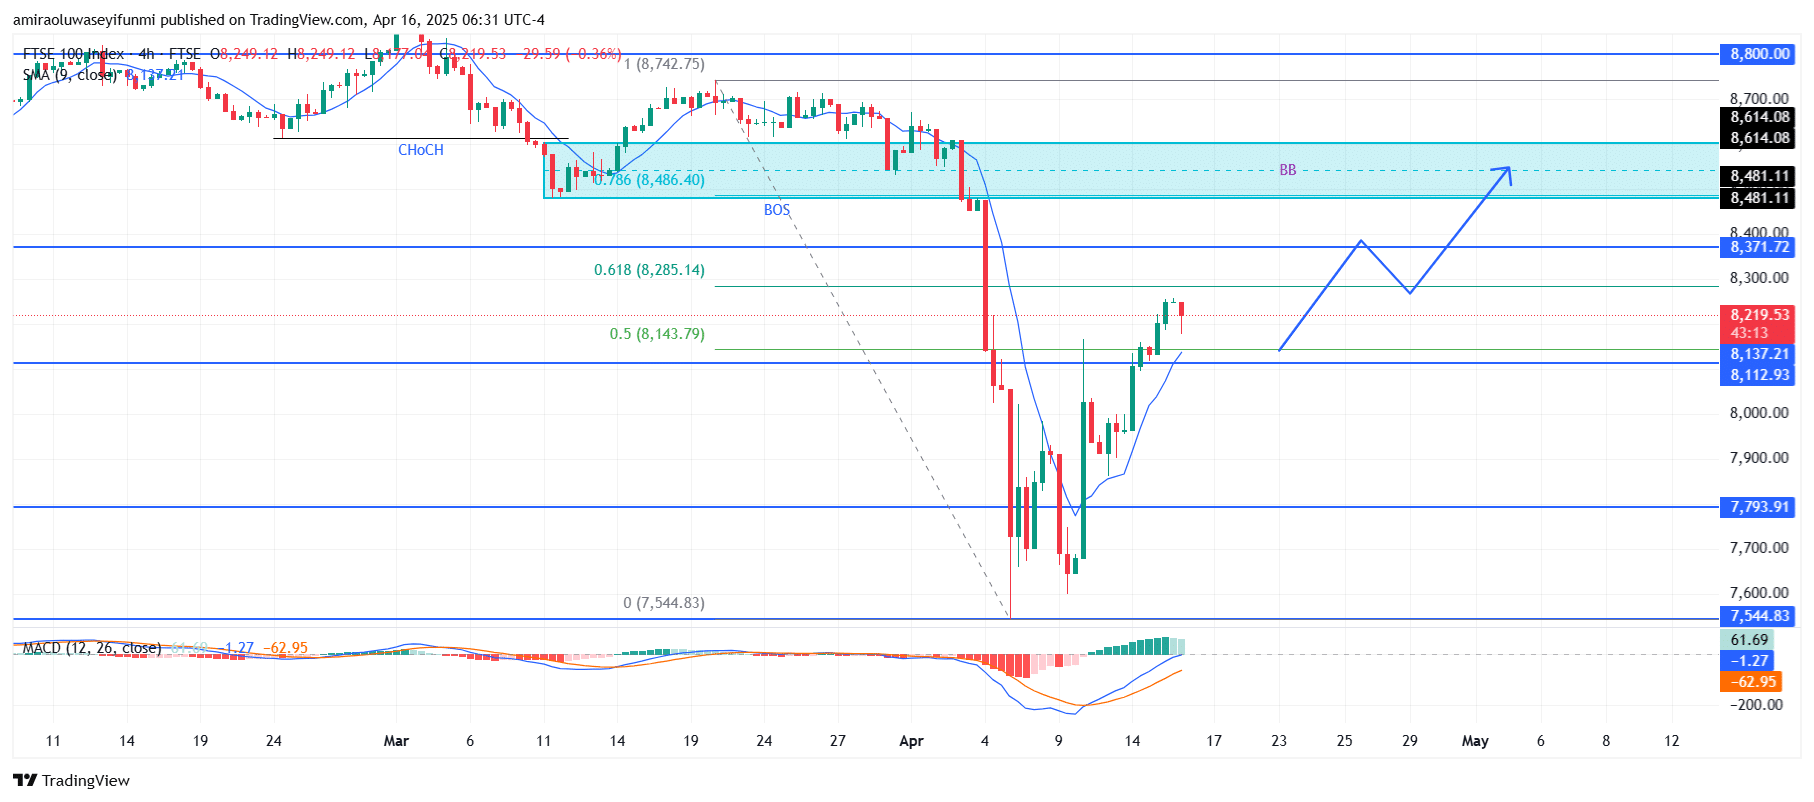
Make money without lifting your fingers: Start using a world-class auto trading solution
How To Buy Lucky Block – Guide, Tips & Insights | Learn 2 Trade
Note: Learn2.trade is not a financial advisor. Do your research before investing your funds in any financial asset, product, or event. We are not responsible for your investment results.
- Broker
- Min Deposit
- Score
- Visit Broker

- Award-winning Cryptocurrency trading platform
- $100 minimum deposit,
- FCA & Cysec regulated

- 20% welcome bonus of upto $10,000
- Minimum deposit $100
- Verify your account before the bonus is credited
- Fund Moneta Markets account with a minimum of $250
- Opt in using the form to claim your 50% deposit bonus
Learn to Trade
Never Miss A Trade Again

Signal Notification
Real-time signal notifications whenever a signal is opened, closes or Updated

Get Alerts
Immediate alerts to your email and mobile phone.

Entry Price Levels
Entry price level for every signal Just choose one of our Top Brokers in the list above to get all this free.