FTSE 100 Analysis – April 9
FTSE 100 has broken clearly below key support levels. The 9-day Simple Moving Average (SMA) is currently positioned at $8,260 and is sloping downward, indicating strong bearish momentum. The price has closed well below this SMA, confirming that sellers remain in control. The Stochastic Oscillator is in the oversold region, with values around 20 and 16, which may suggest a brief relief bounce or consolidation before the downtrend continues. However, momentum still favors the sellers due to the sharp decline and absence of notable bullish divergence.
FTSE 100 Key Levels
Resistance Levels: $8,110, $8,370, $8,800
Support Levels: $7,790, $7,540, $7,220
FTSE100 Long-Term Trend: Bullish
The market has exhibited a clear Change of Character (CHoCH) after failing to maintain highs near $8,910. A Break of Structure (BOS) occurred around $8,370, leading to a steep decline that created a significant liquidity void above $8,050. Recent candlesticks show attempts to retrace, but upward movement has been limited below the void, with continued selling pressure. The rejection beneath $7,790 emphasizes that sellers are defending this key level following the breakdown.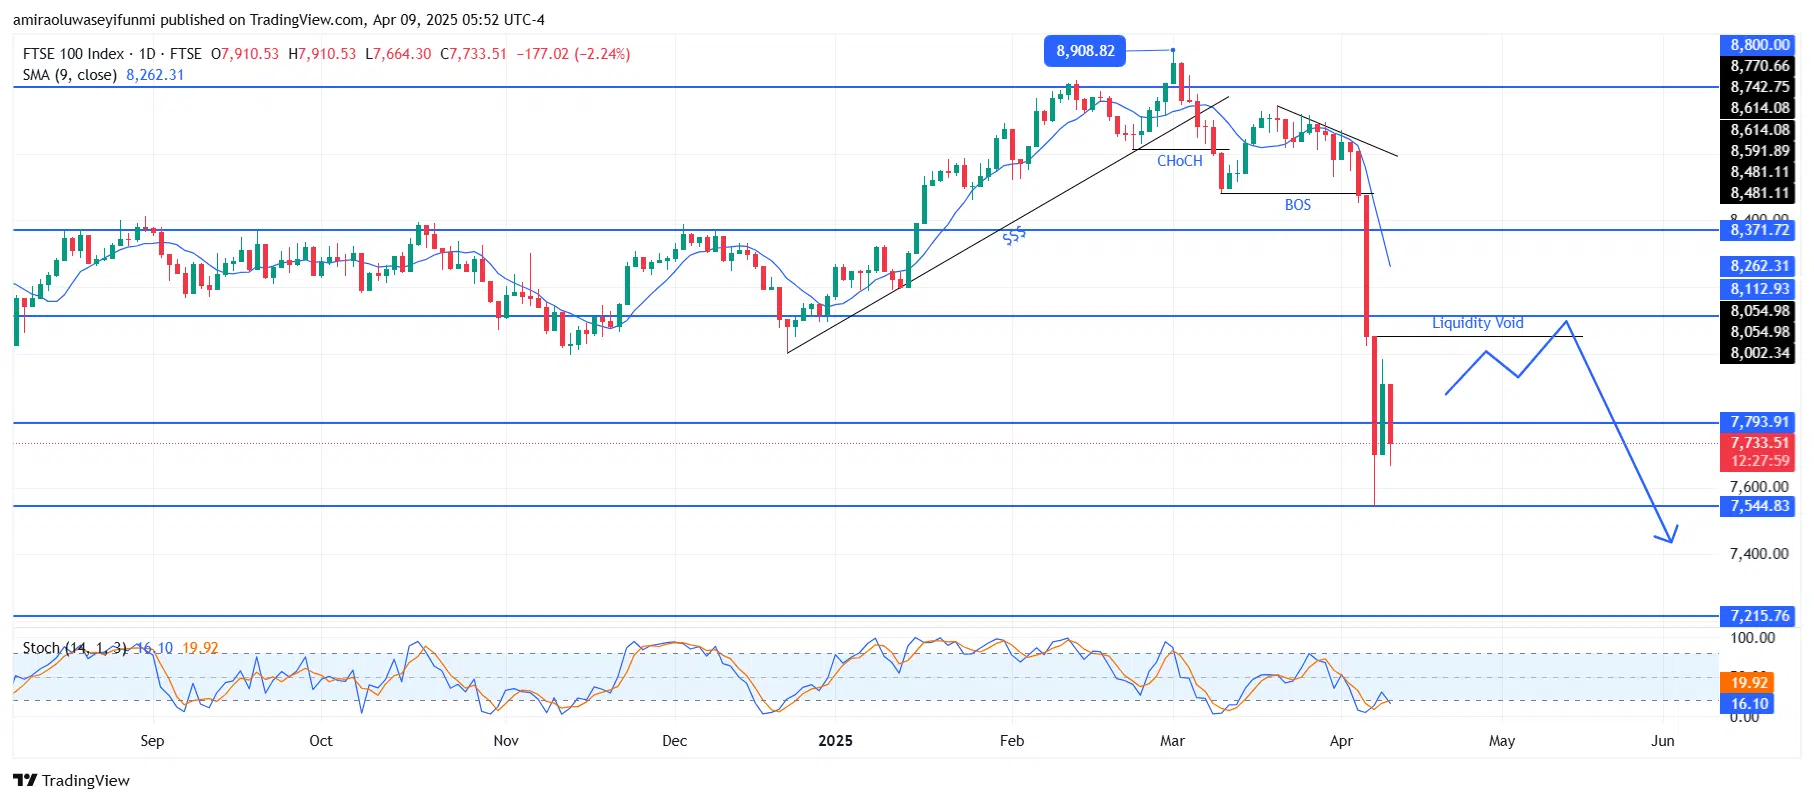
FTSE100 Short-Term Trend: Bullish
On the four-hour chart, FTSE 100 is in an accumulation phase, showing signs of stabilization around the $7,540 support level. The Stochastic Oscillator is beginning to rise from oversold territory, suggesting a possible bullish reversal.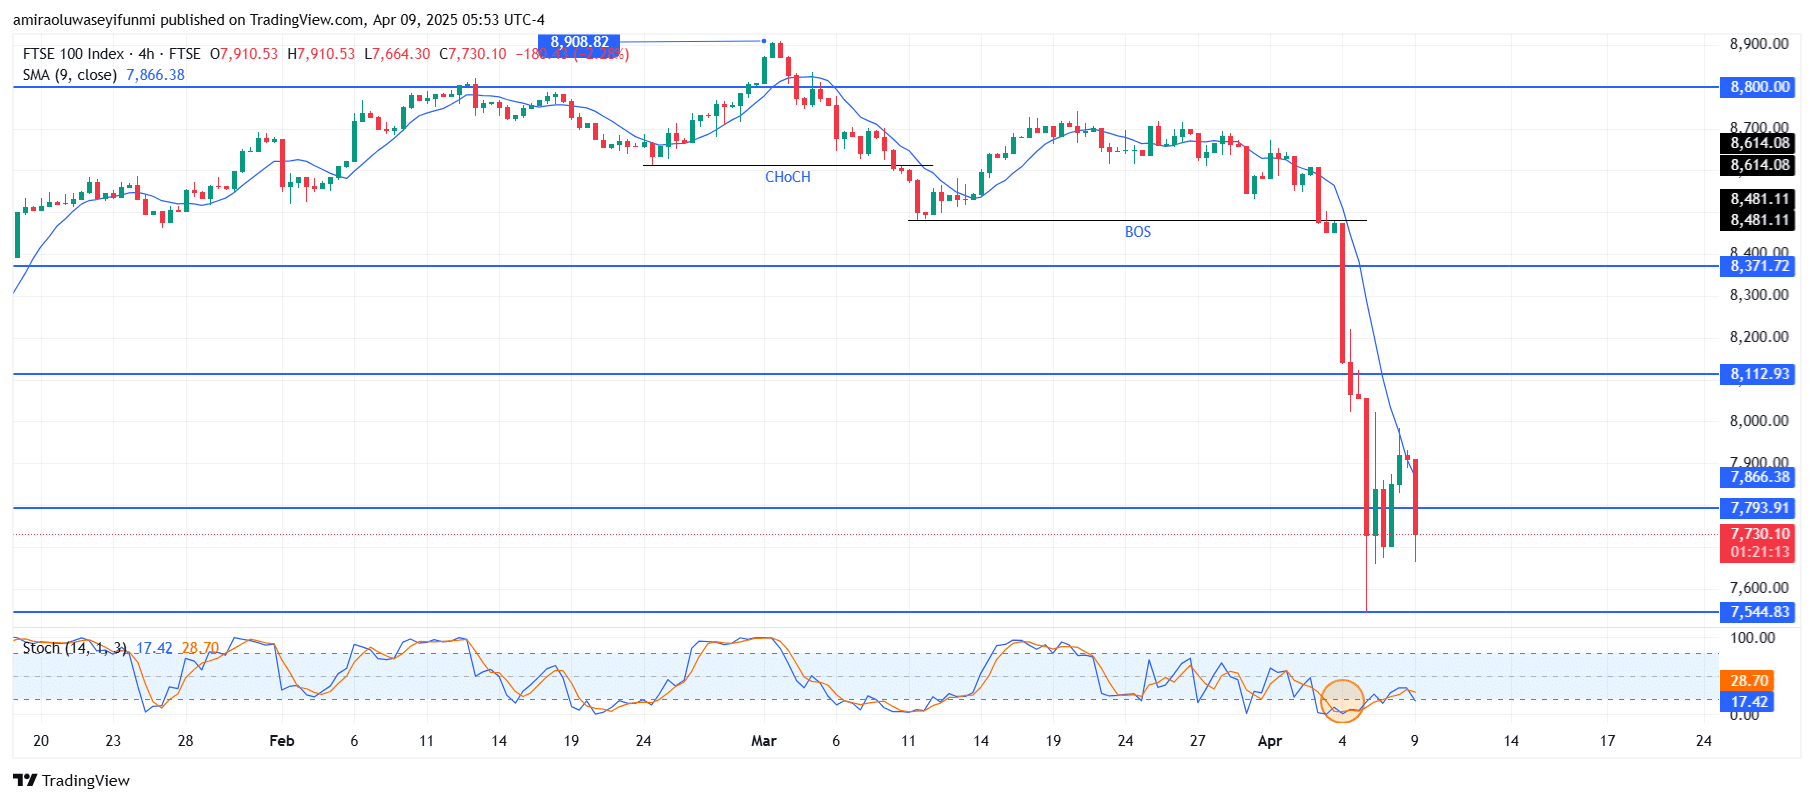
Make money without lifting your fingers: Start using a world-class auto trading solution
How To Buy Lucky Block – Guide, Tips & Insights | Learn 2 Trade
Note: Learn2.trade is not a financial advisor. Do your research before investing your funds in any financial asset, product, or event. We are not responsible for your investment results.
- Broker
- Min Deposit
- Score
- Visit Broker

- Award-winning Cryptocurrency trading platform
- $100 minimum deposit,
- FCA & Cysec regulated

- 20% welcome bonus of upto $10,000
- Minimum deposit $100
- Verify your account before the bonus is credited
- Fund Moneta Markets account with a minimum of $250
- Opt in using the form to claim your 50% deposit bonus
Learn to Trade
Never Miss A Trade Again

Signal Notification
Real-time signal notifications whenever a signal is opened, closes or Updated

Get Alerts
Immediate alerts to your email and mobile phone.

Entry Price Levels
Entry price level for every signal Just choose one of our Top Brokers in the list above to get all this free.