Don’t invest unless you’re prepared to lose all the money you invest. This is a high-risk investment and you are unlikely to be protected if something goes wrong. Take 2 minutes to learn more
Fetch.ai price action has, as of today, witnessed significant movements. Nevertheless, it appears that this price increase hasn’t gone unnoticed by short traders, as indications arising from this market suggest that price action may have started hitting some take-profit marks.
FET Statistics:
FET Value Now: $0.2590
Fetch.ai Market Cap: $212,720,829
Fetch.ai Circulating Supply: 818,505,334
FET Total Supply: 1,152,997,575
Fetch.ai CoinMarketCap Ranking: 121
Major Price Levels:
Top: $0.2590, $0.2640, and $0.2750
Base: $0.2550, $0.2500, and $0.2450
Fetch.ai (FET) Price Action Experiences Rejection in Its Upside Path
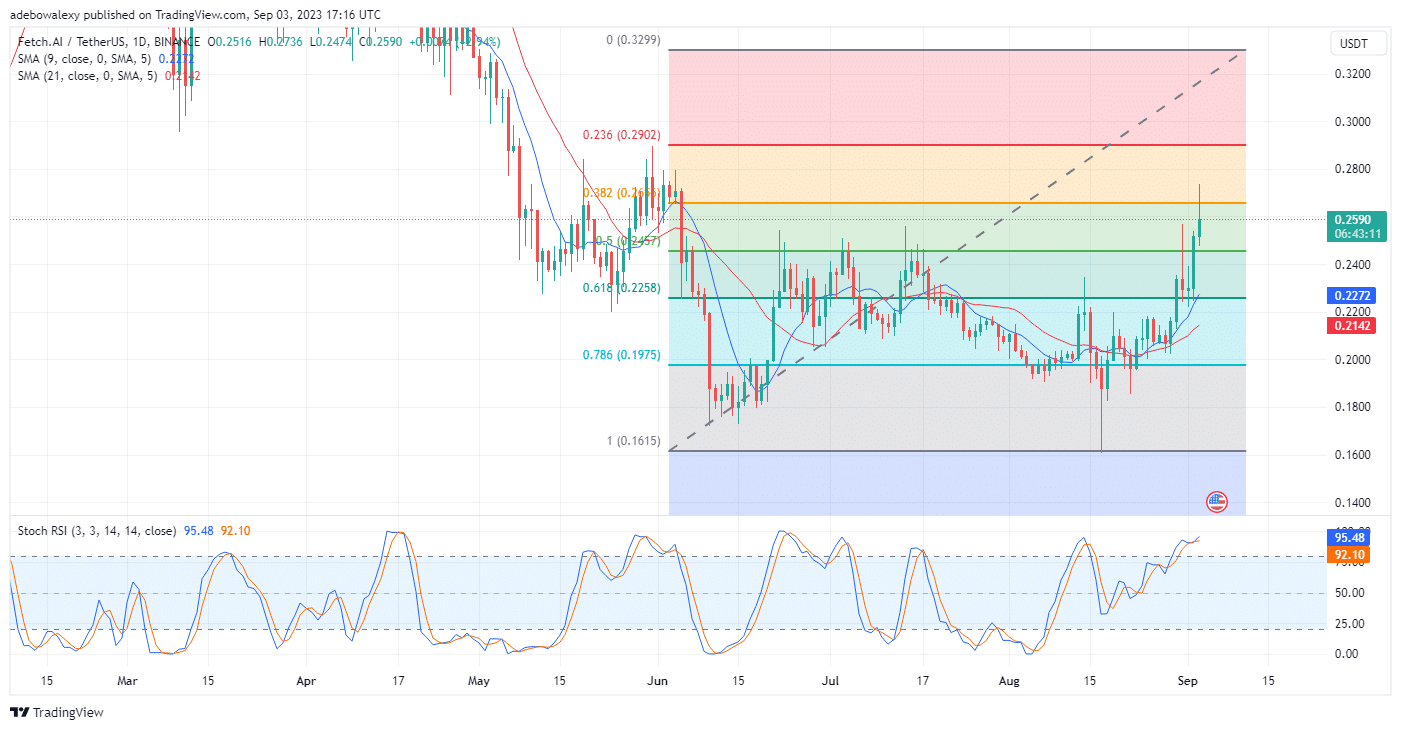
As earlier mentioned, prices in the FETUSDT market have increased significantly today. However, while price action still seems to be on an upward path, it could be perceived that downward forces are presenting some challenges to price action gaining further upside traction. Over recent trading sessions, it could be seen that price action sailed smoothly past the 9- and 21-day Smooth Moving Average lines.
Likewise, the Relative Strength Index (RSI) indicator lines have shown readiness to keep trending in the overbought region. While all indications seem green, the last price candle here seems to hold a negative opinion concerning the ongoing session. This could be seen as the price candle possesses a long shadow above it, which indicates that there have been some price declines in the ongoing trading session.
Headwinds in the FETUSDT Market May Be Getting Stronger
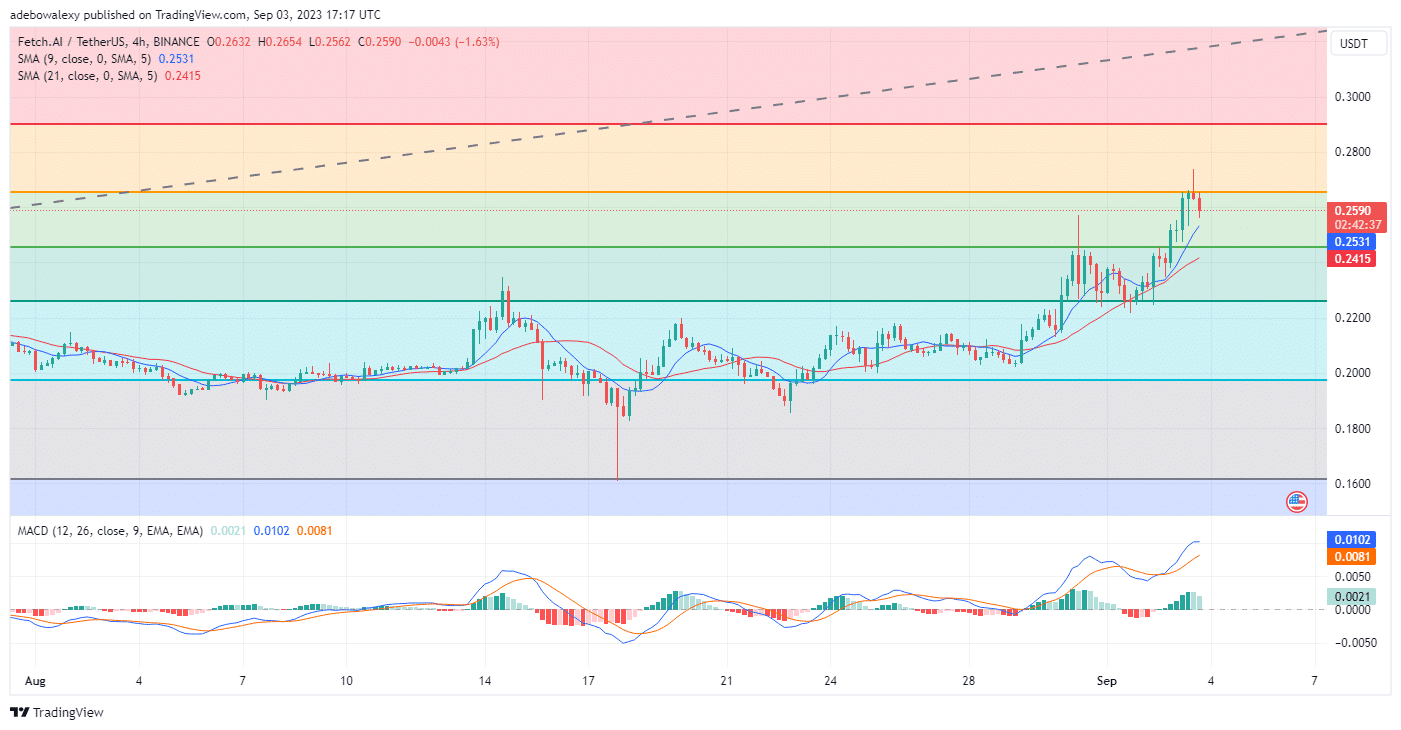
The Fetch.ai 4-hour market seems to elaborate more on the perceived price declines in today’s trading session. Here, it could be seen that a moderate downward correction has occurred in this market, as the price candle from the previous session corrected to the 38.20 Fibonacci Retracement level. Meanwhile, the ongoing session seems to have advanced this downward correction.
As a result, price action in this market draws closer to the 9-day SMA curve as a support. Additionally, the Moving Average Convergence Divergence MACD indicator lines are still above the equilibrium point but could be seen turning sideways following the recent price correction. Also, it could be seen that the bars of this indicator are now pale green, which reveals that the uptrend is weakening. Although traders may maintain a bullish stand in this market towards the $0.2800 price mark, they should ensure that an exit is positioned at a comfortable level should a downward retracement result from here.
- Broker
- Min Deposit
- Score
- Visit Broker

- Award-winning Cryptocurrency trading platform
- $100 minimum deposit,
- FCA & Cysec regulated

- 20% welcome bonus of upto $10,000
- Minimum deposit $100
- Verify your account before the bonus is credited
- Fund Moneta Markets account with a minimum of $250
- Opt in using the form to claim your 50% deposit bonus
Learn to Trade
Never Miss A Trade Again

Signal Notification
Real-time signal notifications whenever a signal is opened, closes or Updated

Get Alerts
Immediate alerts to your email and mobile phone.

Entry Price Levels
Entry price level for every signal Just choose one of our Top Brokers in the list above to get all this free.