Don’t invest unless you’re prepared to lose all the money you invest. This is a high-risk investment and you are unlikely to be protected if something goes wrong. Take 2 minutes to learn more
Fantom’s price has moved upwards by a significant 9.37% on the day, which has seen the token break up the price resistance level at the $0.3000 price mark. Indications coming from this market suggest that price action may want to approach higher price marks as trading continues.
FTM Statistics
Fantom Value Now: $0.3014
Fantom Market Cap: $847M
FTM Circulating Supply: 2,797,295,464.35
FTM Total Supply: 3,175,000,000
Fantom CoinMarketCap Ranking: 46
Major Price Levels:
Top: $0.3014, $0.3100, and $0.3160
Base: $0.3000, $0.2950, and $0.2900
 .3000 Price Region" width="1256" height="668" data-lazy-src="https://learn2.trade/wp-content/uploads/2023/06/FTMUSD_2023-06-21_10-30-29.png"/>
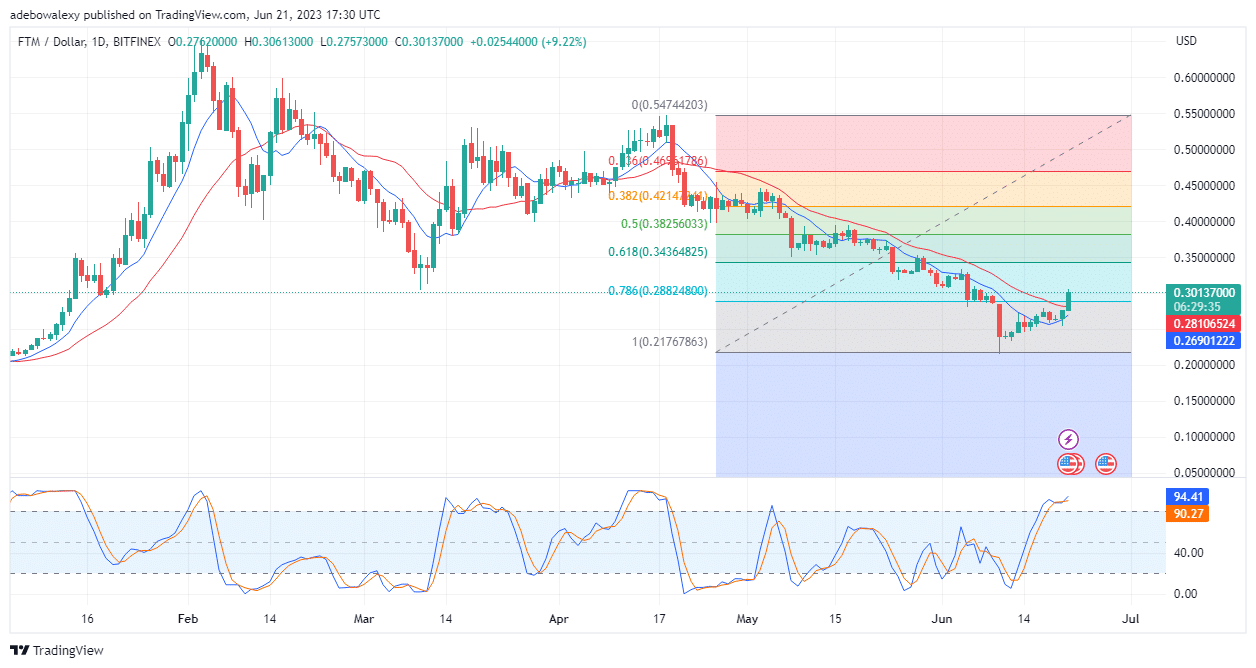
Fantom (FTM) Price Is Eying the $0.3100 Mark
On the daily chart, price action in the FTM/USD market has poked into the bullish region, as suggested by the Fibonacci Retracement tool. A price candle of significant length has just appeared on the chart and has pushed prices above the 78.60 Fibonacci Retracement level.
Meanwhile, price action has also surpassed both the 9- and 21-day Moving Average lines. Consequently, this suggests that the upside retracement may progress further at this point.
Likewise, one can perceive that while the Stochastic Relative Strength Index (RSI) indicator lines are in the overbought region, they have yet to deliver another bullish crossover. The lines of this indicator can now be seen taking a steeper upward bearing. As a result, this reveals that prices may rise more vigorously from here on out.
.3000 Price Region" width="1256" height="668" data-lazy-src="https://learn2.trade/wp-content/uploads/2023/06/FTMUSD_2023-06-21_10-30-49.png"/>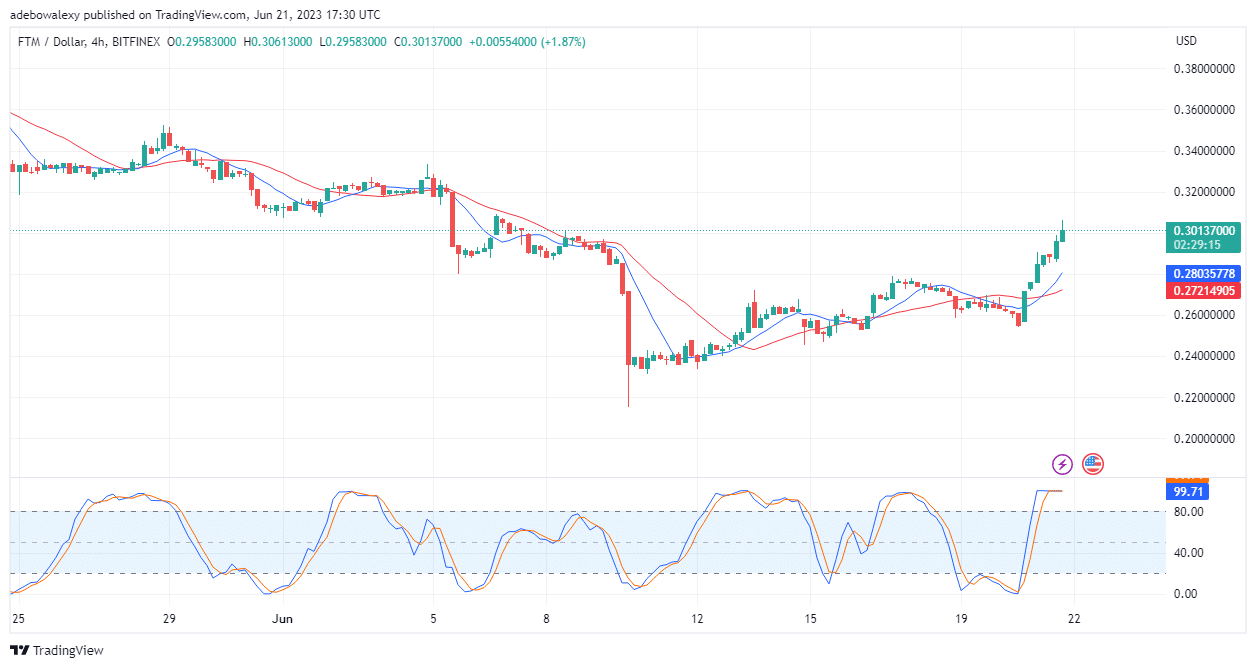
FTM Buyer Seeks to Extend Profits Towards the $0.3100 Price Mark
On the Fantom 4-hour chart, it appears that buyers are ready to retain control of price action. This can be seen as a new session starting with buyers taking the lead, as a green price candle has appeared for the new session.
Similar to what we have on the daily chart, price action stays above both the 9- and 21-day MA lines. This reveals the readiness of buyers to keep pushing prices up. However, the lines of the applied Stochastic RSI indicator can be seen merging and now moving sideways.
This is revealing that price action seems to be facing resistance, yet buyers aren’t ready to let go of price movements. Prices may continue to retrace above the $0.3200 mark, should buyers be able to weary sellers at this point by holding their ground.
- Broker
- Min Deposit
- Score
- Visit Broker

- Award-winning Cryptocurrency trading platform
- $100 minimum deposit,
- FCA & Cysec regulated

- 20% welcome bonus of upto $10,000
- Minimum deposit $100
- Verify your account before the bonus is credited
- Fund Moneta Markets account with a minimum of $250
- Opt in using the form to claim your 50% deposit bonus
Learn to Trade
Never Miss A Trade Again

Signal Notification
Real-time signal notifications whenever a signal is opened, closes or Updated

Get Alerts
Immediate alerts to your email and mobile phone.

Entry Price Levels
Entry price level for every signal Just choose one of our Top Brokers in the list above to get all this free.