Don’t invest unless you’re prepared to lose all the money you invest. This is a high-risk investment and you are unlikely to be protected if something goes wrong. Take 2 minutes to learn more
The price of the Orchid token has only increased by 2.47%, but it appears that it may not increase further. Indications from this market seem a bit divergent at this point, but a careful examination of these signs may prove helpful. This will give us insight into what may soon occur in this market.
OXT Statistics
OXT Value Now: $0.546
Orchid Market Cap: $53,256,877.84
Orchid Circulating Supply: 962,629,339.43
OXT Total Supply: 1,000,000,000
Orchid CoinMarketCap Ranking: 331
Major Price Levels:
Top: $0.560, $0.600, and $0.650
Base: $0.546, $0.500, and $0.450

OXT Price May Correct Toward Support at the $0.520 Price Level
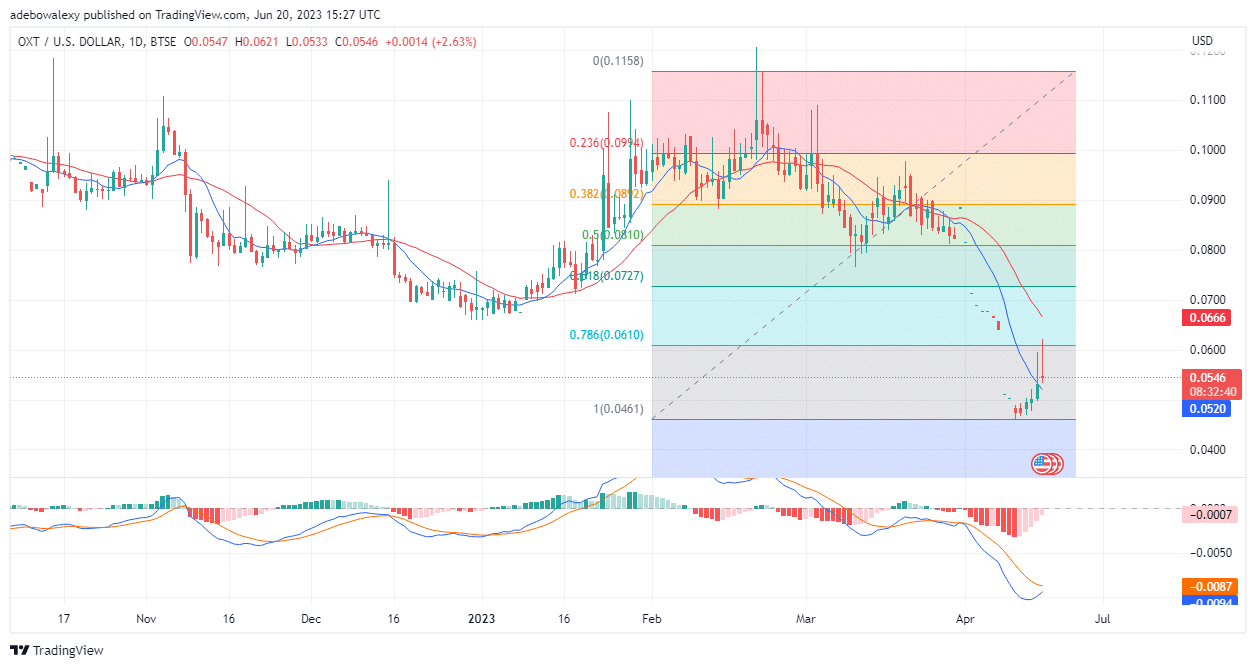
On the Orchid daily market, it could be seen that buyers had only managed to record minimal gains on the day. Yet, not long after price action crossed above the 9-day Moving Average line, shot traders were to seize the opportunity to take some profit off this market.
This can be seen as a red candle with a short body and a long wick that showed up in this market. The appearance of this price candle suggests that price action may have hit a significant amount of take profit in this market. Nevertheless, price action remains above the 9-day MA at this point.
Also, the Moving Average Convergence Divergence indicator is showing that bears are still at the initial stage of gathering momentum as its lines continue to approach each other for a bullish crossover, below the equilibrium point of 0.00.

Orchid Price Action Eyes the $0.520 Mark
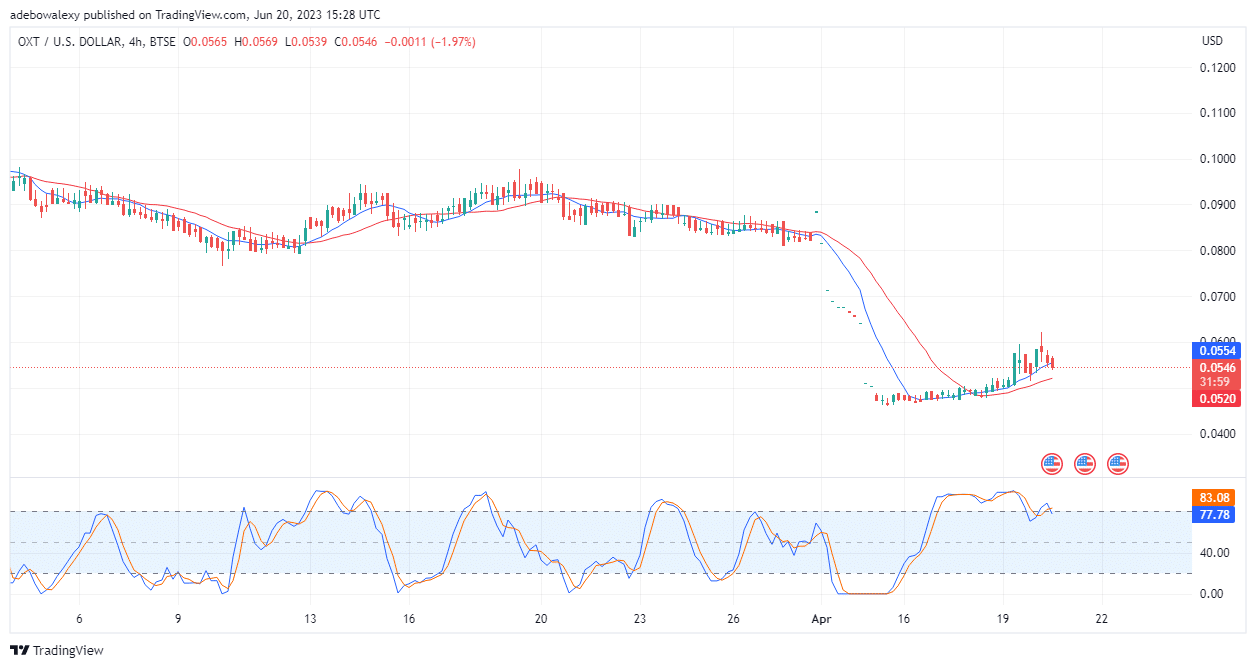
Meanwhile, in the OXT 4-hour market, price action can be seen gathering more bearish momentum, all thanks to short traders. Here, the price action has just broken down the support level at the 9-day MA line. Price action seems to be heading to the next level of support at the 21-day MA curve.
Furthermore, the Stochastic Relative Strength Index (RSI) indicator has delivered a bearish crossover in the overbought region. At this point, both the leading and lagging lines of this indicator are set to decline towards the 70 level.
Consequently, this is revealing that price action now has a bearish tone, which may cause a price correction if price action finds support at the 21-day MA line at the $0.520 price mark. Nevertheless, should the support at the 21-day MA line fail, prices may retrace towards the $0.450 mark.
- Broker
- Min Deposit
- Score
- Visit Broker
- Award-winning Cryptocurrency trading platform
- $100 minimum deposit,
- FCA & Cysec regulated
- 20% welcome bonus of upto $10,000
- Minimum deposit $100
- Verify your account before the bonus is credited
- Fund Moneta Markets account with a minimum of $250
- Opt in using the form to claim your 50% deposit bonus
Learn to Trade
Never Miss A Trade Again

Signal Notification
Real-time signal notifications whenever a signal is opened, closes or Updated

Get Alerts
Immediate alerts to your email and mobile phone.

Entry Price Levels
Entry price level for every signal Just choose one of our Top Brokers in the list above to get all this free.


