Key Resistance Levels: 0.9200, 0.9400, 0.9600
Key Support Levels: 0.8800, 0.8600, 0.8400
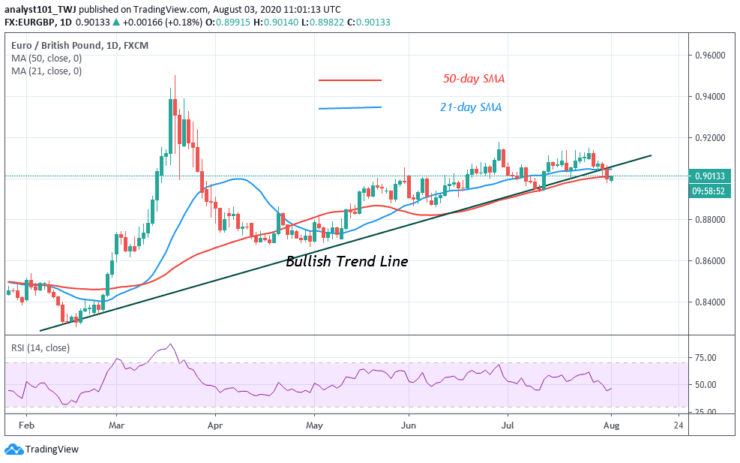
EUR/GBP Price Long-term Trend: Ranging
The EUR/GBP pair is in a downward move after a range-bound movement since May. The price has broken the bullish trend line. It is an indication of a further downward move. The pair is currently correcting upward at level 0.9000.
Daily Chart Indicators Reading:
The pair is at level 45 of the Relative Strength index period 14. This implies that the market is in the downtrend zone and below the centerline 50. The 50-day SMA and 21-day SMA are sloping horizontally. It indicates the present sideways move.
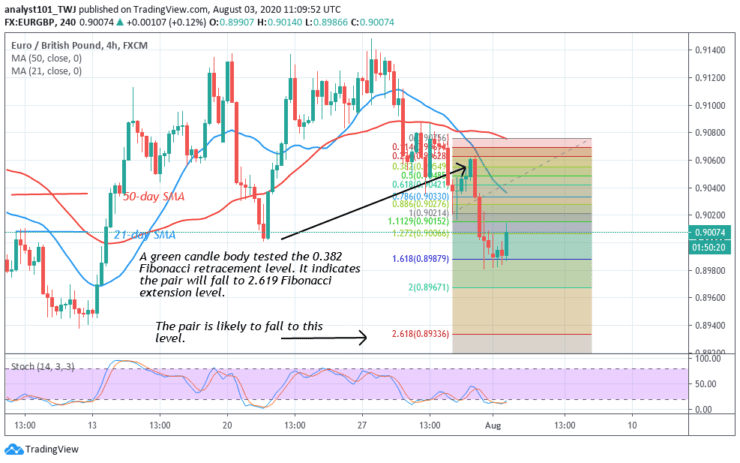
EUR/GBP Medium-term Trend: Bearish
On the 4-hour chart, the EUR/GBP pair is in a downward move. A green candle body tested the 0.382 Fibonacci retracement level. It indicates the pair will fall to the 2.619 Fibonacci extension level. In other words, the market will reach a low of 0.8940.
4-hour Chart Indicators Reading
The 50-day and 21-day SMA are sloping southward indicating the downtrend. The pair is below 20% range of the daily stochastic. It indicates that the market is approaching the oversold region. Also, the pair is in a bearish momentum.
General Outlook for EUR/GBP
The EUR/GBP pair is in a downward move after weeks of a sideways trend. According to the Fibonacci tool, the market will fall and reach a low of 0.8940. In the meantime, price is correcting upward.
Note: Learn2.Trade is not a financial advisor. Do your research before investing your funds in any financial asset or presented product or event. We are not responsible for your investing results
- Broker
- Min Deposit
- Score
- Visit Broker

- Award-winning Cryptocurrency trading platform
- $100 minimum deposit,
- FCA & Cysec regulated

- 20% welcome bonus of upto $10,000
- Minimum deposit $100
- Verify your account before the bonus is credited
- Fund Moneta Markets account with a minimum of $250
- Opt in using the form to claim your 50% deposit bonus
Learn to Trade
Never Miss A Trade Again

Signal Notification
Real-time signal notifications whenever a signal is opened, closes or Updated

Get Alerts
Immediate alerts to your email and mobile phone.

Entry Price Levels
Entry price level for every signal Just choose one of our Top Brokers in the list above to get all this free.