Ethereum (ETH) Current Statistics
The current price: $2,969.96
Market Capitalization: $355.58B
Trading Volume: $30.11B
Major supply zones: $3,000, $3,500, $4,000
Major demand zones: $1,700, $1,500, $1,000
Ethereum (ETH) Price Analysis April 13, 2024
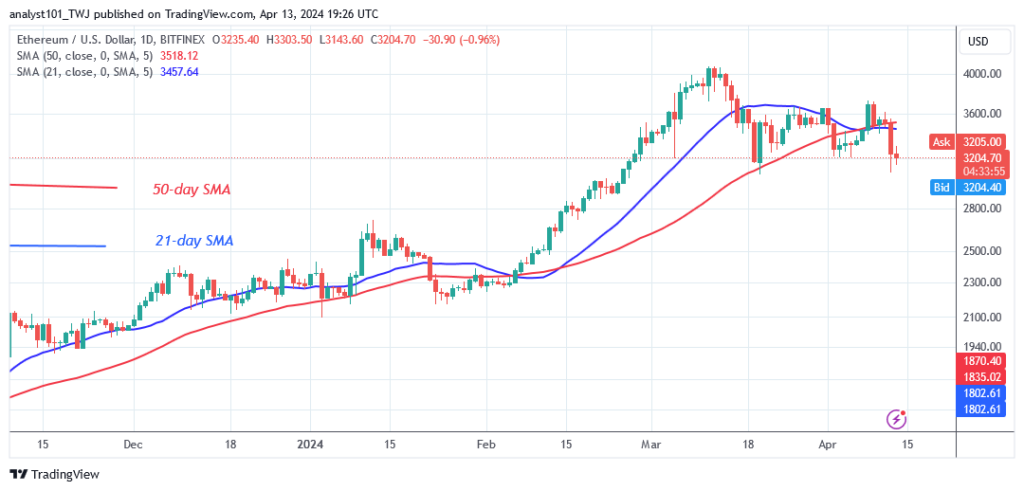
Ethereum’s (ETH) price has fallen below the moving average lines as selling pressure resumes. Today’s decline has resumed and surpassed the existing support at $3,079. The bears smashed through an important support at $3,000 and continued their downward trend.
The current rally has ended as bears breach crucial support. On the downside, bears will try to push the altcoin to the low of $2,700. ETH/USD is currently valued at $2,848.
ETH Technical Indicators Reading
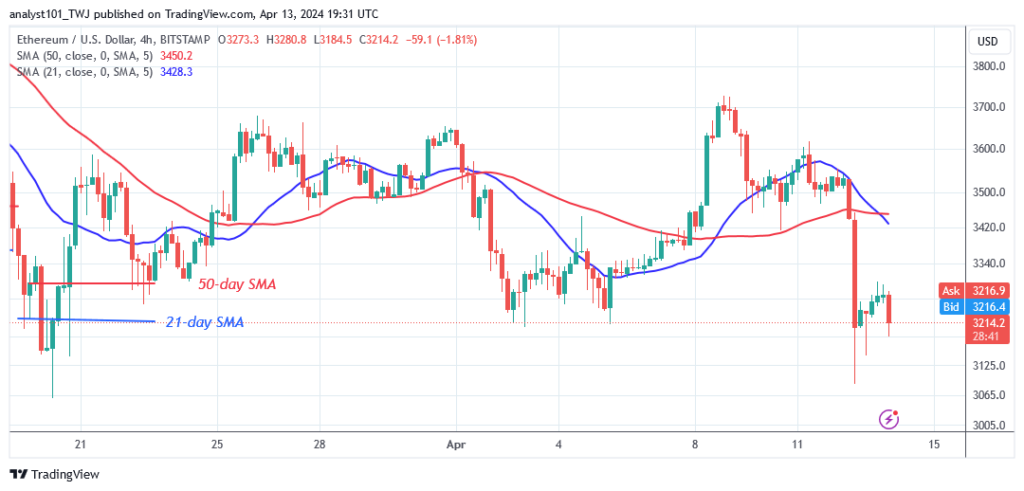
The price bars on the 4-hour chart have fallen sharply below the moving average lines, indicating that the decline has resumed. Ether shows a bearish crossing on both charts, indicating a bearish trend. The 21-day SMA has crossed below the 50-day SMA, indicating that traders should initiate short orders.
Conclusion
Ethereum’s price is falling as the recent uptrend comes to an end as selling pressure resumes. The biggest altcoin has fallen to a low of $2,848. The cryptocurrency asset has fallen significantly to its historical price level of February 21, 2024.
The crypto signal remains negative, with Ether anticipated to reach a low of $2,700.
You can purchase Lucky Block – Guide, Tips & Insights | Learn 2 Trade here. Buy LBLOCK
Note: Learn2.Trade is not a financial advisor. Do your research before investing your funds in any financial asset or presented product or event. We are not responsible for your investing results
- Broker
- Min Deposit
- Score
- Visit Broker

- Award-winning Cryptocurrency trading platform
- $100 minimum deposit,
- FCA & Cysec regulated

- 20% welcome bonus of upto $10,000
- Minimum deposit $100
- Verify your account before the bonus is credited
- Fund Moneta Markets account with a minimum of $250
- Opt in using the form to claim your 50% deposit bonus
Learn to Trade
Never Miss A Trade Again

Signal Notification
Real-time signal notifications whenever a signal is opened, closes or Updated

Get Alerts
Immediate alerts to your email and mobile phone.

Entry Price Levels
Entry price level for every signal Just choose one of our Top Brokers in the list above to get all this free.