Ethereum (ETH) Current Statistics
The current price: $3,491.58
Market Capitalization: $419,728,710,736
Trading Volume: $17,800,740,912
Major supply zones: $3,000, $3,500, $4,000
Major demand zones: $1,700, $1,500, $1,000
Ethereum (ETH) Price Analysis April 9, 2024
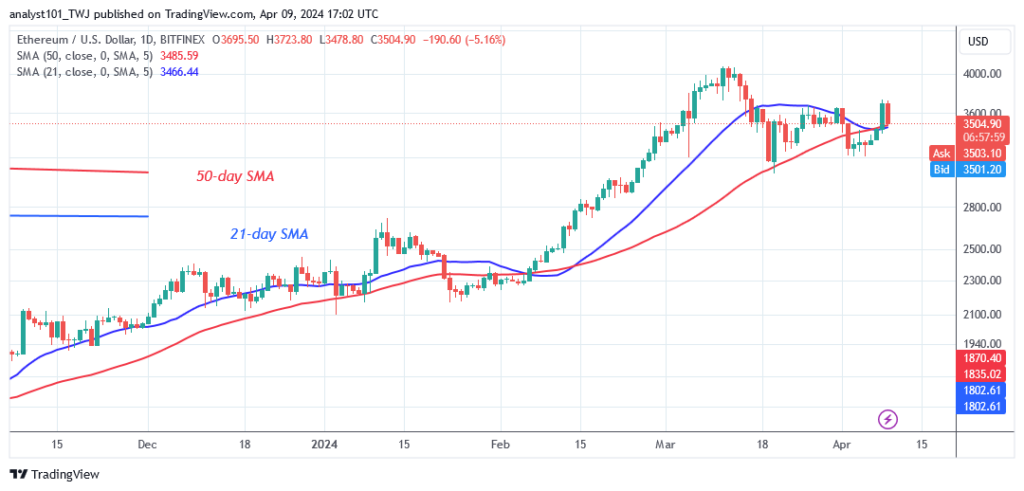
Ethereum’s (ETH) price breaks above the moving average lines, reaching a high of $3,731 but returns to its range. The altcoin was repulsed at its recent high, but it has since declined above the moving average. The cryptocurrency’s price will rise again if the 21-day SMA support holds.
The altcoin will rise and return to the prior high of $4,000. On the downside, if the negative momentum continues below the moving average lines, Ether will revert to its earlier level above the $3,200 support. Meanwhile, the ETH/USD exchange rate is at $3,503 at the time of writing.
ETH Technical Indicators Reading
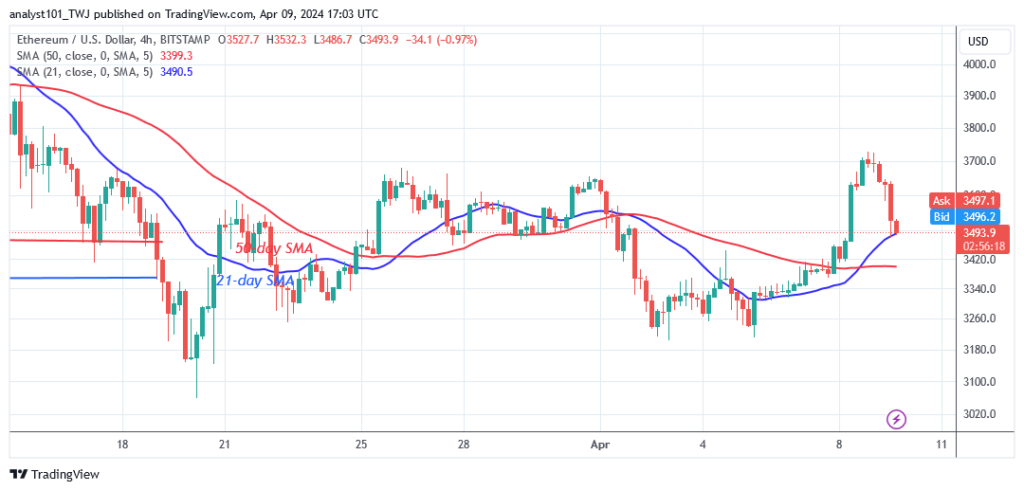
Following the latest price rally, Ether’s price bars are now above the moving average lines. On the 4-hour chart, the price bars are above the moving average line, but they have slightly broken below it.
Conclusion
Ethereum faces harsh rejection at the recent high as it returns to its range. The bears are seeking to break below the moving average lines following the rejection at the $3,700 high. Currently, the crypto signal is unfavorable as the altcoin begins its selling pressure.
You can purchase Lucky Block – Guide, Tips & Insights | Learn 2 Trade here. Buy LBLOCK
Note: Learn2.Trade is not a financial advisor. Do your research before investing your funds in any financial asset or presented product or event. We are not responsible for your investing results
- Broker
- Min Deposit
- Score
- Visit Broker

- Award-winning Cryptocurrency trading platform
- $100 minimum deposit,
- FCA & Cysec regulated

- 20% welcome bonus of upto $10,000
- Minimum deposit $100
- Verify your account before the bonus is credited
- Fund Moneta Markets account with a minimum of $250
- Opt in using the form to claim your 50% deposit bonus
Learn to Trade
Never Miss A Trade Again

Signal Notification
Real-time signal notifications whenever a signal is opened, closes or Updated

Get Alerts
Immediate alerts to your email and mobile phone.

Entry Price Levels
Entry price level for every signal Just choose one of our Top Brokers in the list above to get all this free.