Key Highlights
Ether is in a sideways trend for the past five days
Possibly a breakout is imminent
Ethereum (ETH) Current Statistics
The current price: $356.80
Market Capitalization: $40,249,317,062
Trading Volume: $11,822,143,664
Major supply zones: $280, $320, $360
Major demand zones: $160, $140, $100
Ethereum (ETH) Price Analysis September 30, 2020
Following its recent rebound on September 24, Ether has been trading below the $370 resistance. Ether price has been stuck in the resistance zone for the past five days. The bottom line is that if buyers break the resistance zone and push price above $390, Ethereum will be out of downward correction. Perhaps, the upside momentum will resume. Conversely, if the coin faces rejection at the current resistance, the market will fall. The bears may attempt to sink the coin to its previous low at $310.
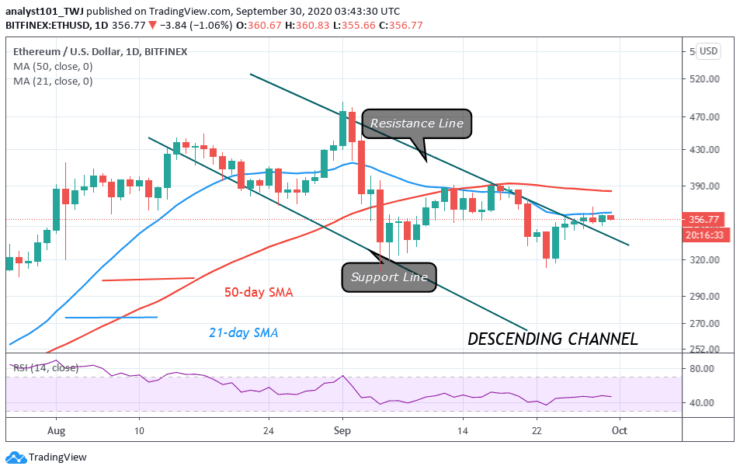
ETH Technical Indicators Reading
The price is still below the EMAs which suggests that the coin is not likely to rise. Rather, it may fall or the price fluctuations will continue. The coin is at level 47 of the Relative Strength Index period 14. That is, the coin is in the downtrend zone and below the centerline 50.
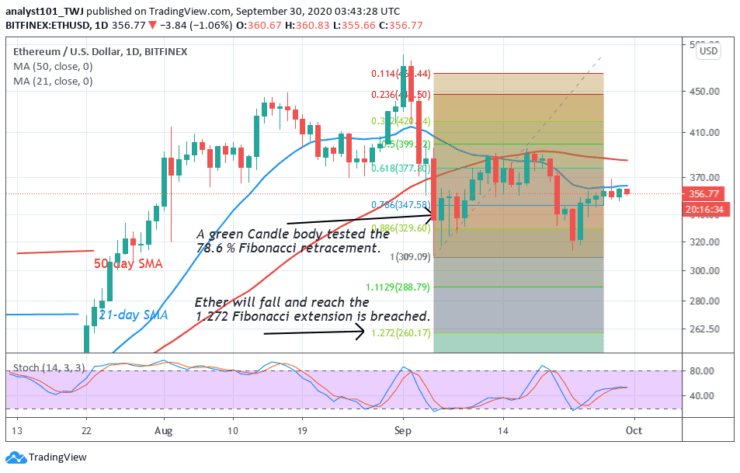
Conclusion
It is not certain the direction of price movement as the coin has been range-bound for the past five days. The Fibonacci tool analysis will hold if Ether falls and price breaks the critical support at $310. The market will continue its fall towards the 1.272 Fibonacci extension or $260 low.
Note: Learn2.Trade is not a financial advisor. Do your research before investing your funds in any financial asset or presented product or event. We are not responsible for your investing results
- Broker
- Min Deposit
- Score
- Visit Broker

- Award-winning Cryptocurrency trading platform
- $100 minimum deposit,
- FCA & Cysec regulated

- 20% welcome bonus of upto $10,000
- Minimum deposit $100
- Verify your account before the bonus is credited
- Fund Moneta Markets account with a minimum of $250
- Opt in using the form to claim your 50% deposit bonus
Learn to Trade
Never Miss A Trade Again

Signal Notification
Real-time signal notifications whenever a signal is opened, closes or Updated

Get Alerts
Immediate alerts to your email and mobile phone.

Entry Price Levels
Entry price level for every signal Just choose one of our Top Brokers in the list above to get all this free.