Key Highlights
Ethereum faces rejection at $420, may drop to $382
Ether will reach a low of $320 if the selling pressure persists
Ethereum (ETH) Current Statistics
The current price: $387.56
Market Capitalization: $43,869,223,825
Trading Volume: $17,057,619,506
Major supply zones: $280, $320, $360
Major demand zones: $160, $140, $100
Ethereum (ETH) Price Analysis October 28, 2020
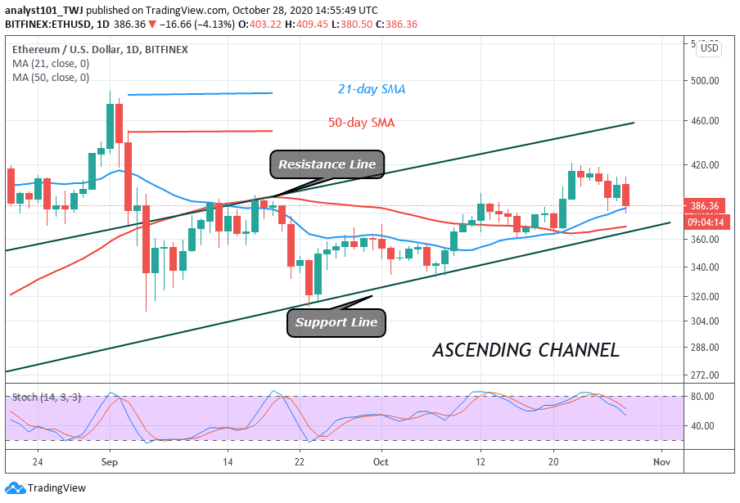
Ethereum is on a downward move after failing to break the resistance at $420. The coin has been on a downward move after the rejection at the recent high. Today, the coin has fallen and reached a low at $382. On the downside, if the bears break below the $380 support, the downtrend will resume. The crypto will drop to the low at $320. On the other hand, if the $380 support holds, the uptrend will resume. Buyers will push the price upward and attempt to revisit the previous high.
ETH Technical Indicators Reading
The price has fallen to the support above the 21-day SMA. A break below the SMAs will mean a further downward movement of the coin. The biggest altcoin is below the 80% range of the daily stochastic. It indicates that the coin is in a bearish momentum.
Conclusion
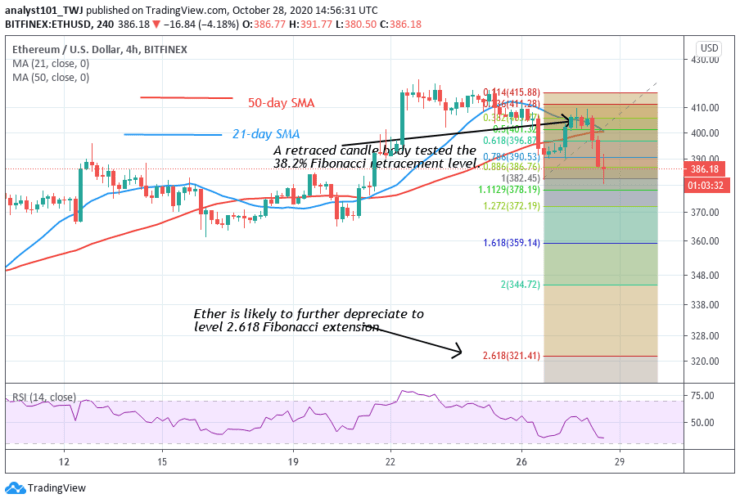
Ethereum is trading above the critical support at $380. The Fibonacci analysis will hold if the bears break the $380 support. On October 26 downtrend; the retraced candle tested the 38.2% Fibonacci retracement level. It indicates that the market will fall to a level 2.618 Fibonacci extension. That is at the low of $321.41.
Note: Learn2.Trade is not a financial advisor. Do your research before investing your funds in any financial asset or presented product or event. We are not responsible for your investing result
- Broker
- Min Deposit
- Score
- Visit Broker

- Award-winning Cryptocurrency trading platform
- $100 minimum deposit,
- FCA & Cysec regulated

- 20% welcome bonus of upto $10,000
- Minimum deposit $100
- Verify your account before the bonus is credited
- Fund Moneta Markets account with a minimum of $250
- Opt in using the form to claim your 50% deposit bonus
Learn to Trade
Never Miss A Trade Again

Signal Notification
Real-time signal notifications whenever a signal is opened, closes or Updated

Get Alerts
Immediate alerts to your email and mobile phone.

Entry Price Levels
Entry price level for every signal Just choose one of our Top Brokers in the list above to get all this free.