Key Highlights
Ethereum fluctuates between levels $2,600 and $3,200
Ether may slump to level $2,035
Ethereum ETH) Current Statistics
The current price: $3,006.72
Market Capitalization: $353,835,854,770
Trading Volume: $21,809,764,847
Major supply zones: $3,000, $3,500, $4,000
Major demand zones: $2,500, $2,000, $1,500
Ethereum (ETH) Price Analysis September 26, 2021
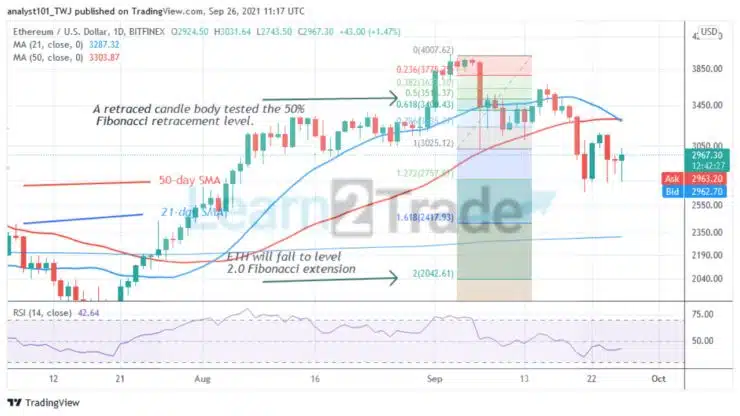
After the September 21 bearish impulse, Ethereum’s (ETH) price fell to the low of $2,656 as bulls bought the dips. For the past week, the biggest altcoin has been fluctuating between $2,600 and $3,200. The uptrend will resume if price breaks above the $3,400 high. Also, the market will decline if the bears break below the $2,600 support. Meanwhile, on September 7 downtrend; a retraced candle body tested the 50 % Fibonacci retracement level. The retracement indicates that Ether will fall to level 2.0 Fibonacci extension or level $2,042.61.
ETH Technical Indicators Reading
Ether’s price is at level 42 of the Relative Strength index period 14. It indicates that the altcoin is in the downtrend zone and below the centerline 50. Ether is having a bearish crossover as the 21-day SMA crosses over the 50-day SMA. The coin is above the 40% range of the daily stochastic. It indicates that the market is in the bullish trend zone. The biggest altcoin is rising but may face stiff resistance at a recent high.
Conclusion
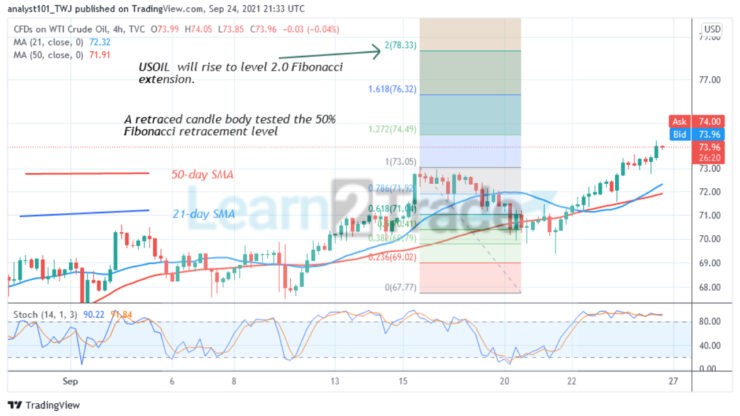
On the 4-hour chart, Ethereum is in a downward move. The bears are finding penetration difficult at the low of $2,656. The downtrend will resume if the previous low is breached. Meanwhile, on September 21 downtrend; a retraced candle body tested the 61.8 % Fibonacci retracement level. The retracement indicates that Ether will fall to level 1.618 Fibonacci extension or level $2,042.16.
You can purchase crypto coins here. Buy Tokens
Note: Learn2.Trade is not a financial advisor. Do your research before investing your funds in any financial asset or presented product or event. We are not responsible for your investing
- Broker
- Min Deposit
- Score
- Visit Broker

- Award-winning Cryptocurrency trading platform
- $100 minimum deposit,
- FCA & Cysec regulated

- 20% welcome bonus of upto $10,000
- Minimum deposit $100
- Verify your account before the bonus is credited
- Fund Moneta Markets account with a minimum of $250
- Opt in using the form to claim your 50% deposit bonus
Learn to Trade
Never Miss A Trade Again

Signal Notification
Real-time signal notifications whenever a signal is opened, closes or Updated

Get Alerts
Immediate alerts to your email and mobile phone.

Entry Price Levels
Entry price level for every signal Just choose one of our Top Brokers in the list above to get all this free.