Key Highlights
Ethereum bears break price range of between $1,640 and $1.760
Ether plunges to $1,500 as bulls buy the dips
Ethereum ETH) Current Statistics
The current price: $1,590.09
Market Capitalization: $181,549,767,904
Trading Volume: $40,117,939,936
Major supply zones: $1,500, $1,600, $1,700
Major demand zones: $600, $500, $400
Ethereum (ETH) Price Analysis February 7, 2020
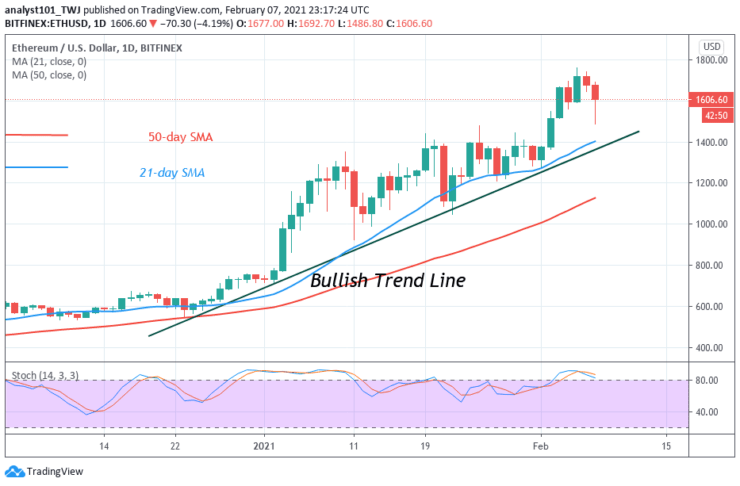
Ether has plunged to $1.486.80 as bulls buy the dips. The biggest altcoin has commenced a fresh uptrend after it fell below the current price range. Before now Ether was fluctuating between levels $1,640 and $1,760 as bulls fail to break the $1.760 resistance level. On the upside, if the price breaks the $1,760 resistance, the market will rise to reach the targeted price level of $2,000. Otherwise, the current fluctuation will persist between the current ranges.
ETH Technical Indicators Reading
Ether is also above the 80% range of the daily stochastic. The coin is in an overbought region of the market. It is in bullish momentum. The biggest altcoin is at level 48 of the Relative Strength Index period 14.
Conclusion
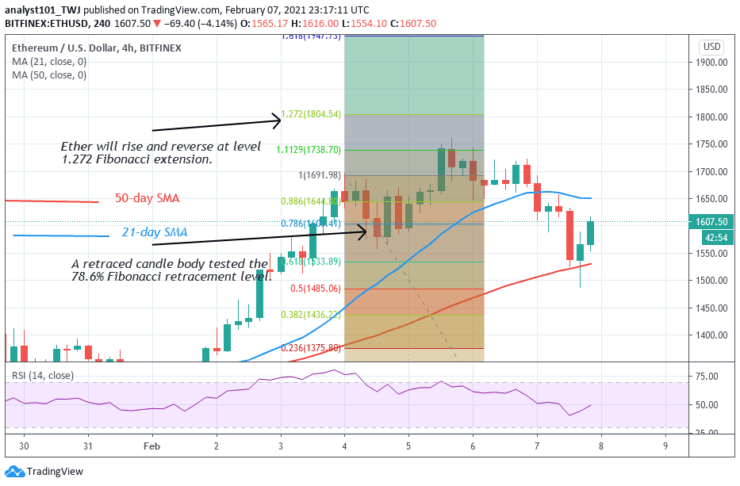
Ethereum fell after rejection from the $1,760 resistance. The Fibonacci has indicated an upward move and later a retracement. On February 4 uptrend; a retraced candle body tested the 78.6% Fibonacci retracement level. It indicates that the market will rise to level 1.272 Fibonacci extension or the high of $1,804.54. Later it will reverse to 78.6% Fibonacci retracement level.
Note: Learn2.Trade is not a financial advisor. Do your research before investing your funds in any financial asset or presented product or event. We are not responsible for your investing
- Broker
- Min Deposit
- Score
- Visit Broker

- Award-winning Cryptocurrency trading platform
- $100 minimum deposit,
- FCA & Cysec regulated

- 20% welcome bonus of upto $10,000
- Minimum deposit $100
- Verify your account before the bonus is credited
- Fund Moneta Markets account with a minimum of $250
- Opt in using the form to claim your 50% deposit bonus
Learn to Trade
Never Miss A Trade Again

Signal Notification
Real-time signal notifications whenever a signal is opened, closes or Updated

Get Alerts
Immediate alerts to your email and mobile phone.

Entry Price Levels
Entry price level for every signal Just choose one of our Top Brokers in the list above to get all this free.