Highlights
Ethereum price rebounds above $4,700 support
Ether bulls target $4,820 resistance
Ethereum ETH) Current Statistics
The current price: $4,832.88
Market Capitalization: $573,920,310,843
Trading Volume: $18,787,918,479
Major supply zones: $4,000, $4,500, $5,000
Major demand zones: $3,500, $3,000, $2,500
Ethereum (ETH) Price Analysis November 10, 2021
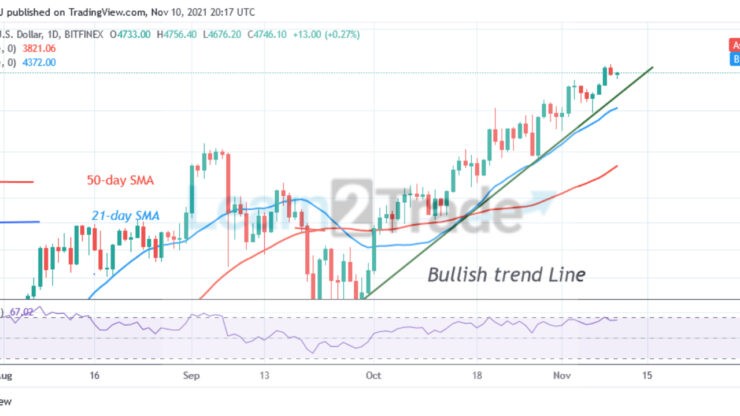
Since September 29, Ethereum’s (ETH) price is in an uptrend. Ether’s price has been making a series of higher highs and higher lows. On November 8, Ether’s price made a higher high of $4,820. Since November 9, Ether’s price has been fallen to make a higher low. Once that is established, the uptrend will resume. This has been the price action for some time. The uptrend will continue as long as the price bars are above the moving averages and the trend line.
ETH Technical Indicators Reading
Ethereum is at level 65 of the Relative Strength Index for period 14. The RSI is sloping horizontally. A bullish trend line is drawn showing the support levels of prices. If price breaks and closes below the trend line, the uptrend may be terminated. Ether is above the 80% range of the daily stochastic. The stochastic bands have been sloping in the overbought region for some time.
Conclusion
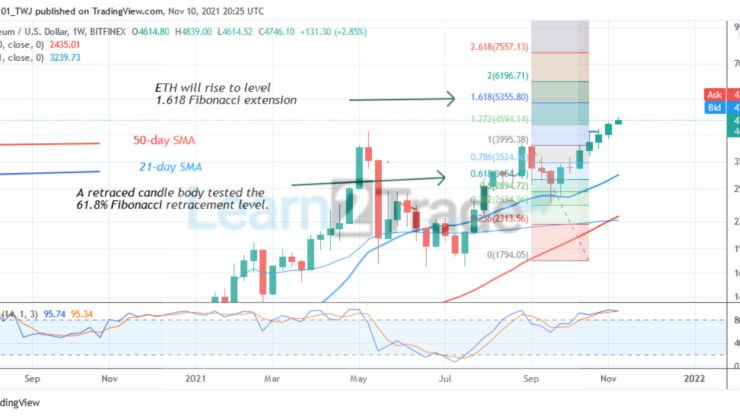
On a weekly chart, ETH/USD is in a smooth uptrend. Meanwhile, on September 20; a retraced candle body tested the 61.8% Fibonacci retracement level. The retracement indicates that Ether will rise to level 1.618 Fibonacci extensions or $5,355. 80.
You can purchase crypto coins here. Buy Tokens
Note: Learn2.Trade is not a financial advisor. Do your research before investing your funds in any financial asset or presented product or event. We are not responsible for your investing
- Broker
- Min Deposit
- Score
- Visit Broker

- Award-winning Cryptocurrency trading platform
- $100 minimum deposit,
- FCA & Cysec regulated

- 20% welcome bonus of upto $10,000
- Minimum deposit $100
- Verify your account before the bonus is credited
- Fund Moneta Markets account with a minimum of $250
- Opt in using the form to claim your 50% deposit bonus
Learn to Trade
Never Miss A Trade Again

Signal Notification
Real-time signal notifications whenever a signal is opened, closes or Updated

Get Alerts
Immediate alerts to your email and mobile phone.

Entry Price Levels
Entry price level for every signal Just choose one of our Top Brokers in the list above to get all this free.