Key Highlights
Ethereum fluctuates between $2,001 and $2,142 price levels
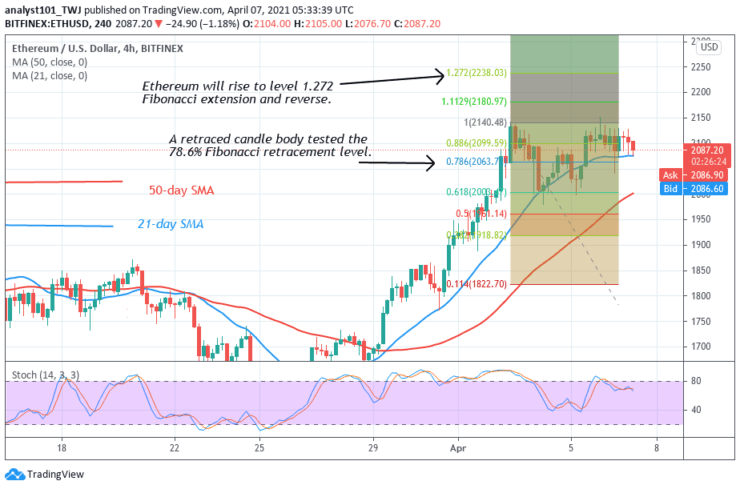
The biggest altcoin has a target price of $2238.03
Ethereum ETH) Current Statistics
The current price: $2,085.25
Market Capitalization: $28,557,558,824
Trading Volume: 115,367,292 ETH
Major supply zones: $2,000, $2,200, $2,400
Major demand zones: $1,800, $51,600, $1,400
Ethereum (ETH) Price Analysis April 7, 2021
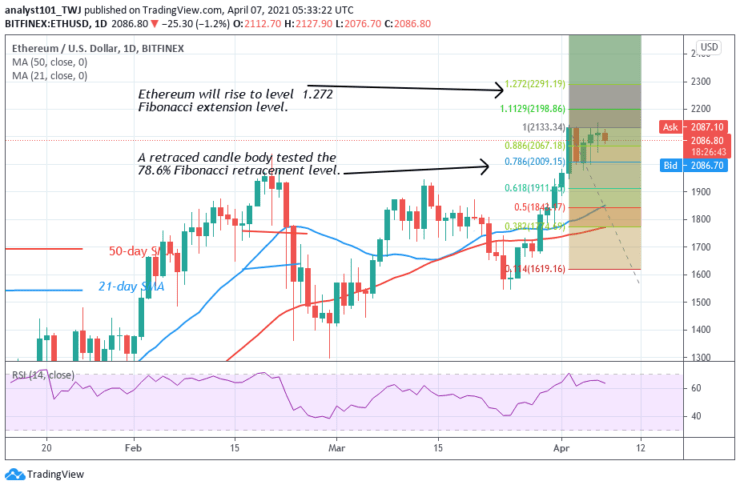
Following the attainment of its peak price, the biggest altcoin is fluctuating below the recent high. Ether retraces to $2,001 low and resumed fluctuation below the recent high. On April 2 uptrend; a retraced candle body tested the 78.6% Fibonacci retracement level. The retracement indicates that Ethereum will rise to level 1.272 Fibonacci extension or $2,291.19. Ether will reverse at the recent high to the 78.6% Fibonacci retracement where it originated.
ETH Technical Indicators Reading
Ethereum has risen to level 64 of the Relative Strength Index period 14. The altcoin is in the uptrend zone and it approaching the oversold region. The SMAs are sloping upward indicating the uptrend. The crypto’s price is above the SMAs which suggests a possible rise in price.
Conclusion
Ethereum is fluctuating in a price range and it is likely to move upward. On April 2, a retraced candle body tested the 78.6% Fibonacci retracement on April 3 and 5. This also confirmed that the market will rise to level 1.272 Fibonacci extension on the 4-hour chart. That is the high of $2238.03.
You can purchase crypto coins here: Buy Coins
Note: Learn2.Trade is not a financial advisor. Do your research before investing your funds in any financial asset or presented product or event. We are not responsible for your investing results
- Broker
- Min Deposit
- Score
- Visit Broker

- Award-winning Cryptocurrency trading platform
- $100 minimum deposit,
- FCA & Cysec regulated

- 20% welcome bonus of upto $10,000
- Minimum deposit $100
- Verify your account before the bonus is credited
- Fund Moneta Markets account with a minimum of $250
- Opt in using the form to claim your 50% deposit bonus
Learn to Trade
Never Miss A Trade Again

Signal Notification
Real-time signal notifications whenever a signal is opened, closes or Updated

Get Alerts
Immediate alerts to your email and mobile phone.

Entry Price Levels
Entry price level for every signal Just choose one of our Top Brokers in the list above to get all this free.