Ethereum (ETH) Price Analysis: Daily Chart – Bearish
Key resistance levels: $158, $177
Key support levels: $138, $131
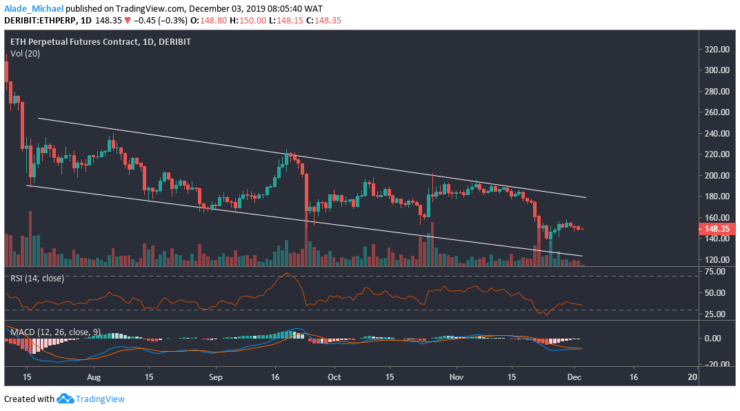
The daily outlook for Ethereum shows a bearish momentum which appears unending at the moment. Following last week sell-off, ETH has managed to recover a bit after locating support near the channel’s lower boundary at $132. If the buyers can continue to act upon this support, the price of ETH may reclaim $158 and $177 resistance. But as it stands now, the market is under a small bearish correction.

Before we can consider an upward move, Ether needs to move out of the descending channel. Looking at the last few days of drops, ETH may retest near support at $138 and possibly $131. As shown on the technical indicators, the MACD is still in a bearish condition. Though, the RSI has recovered from the oversold condition but remains in a downward direction. We can expect a price increase as soon as the buyers step back into the market.
Ethereum (ETH) Price Analysis: Hourly Chart – Bearish
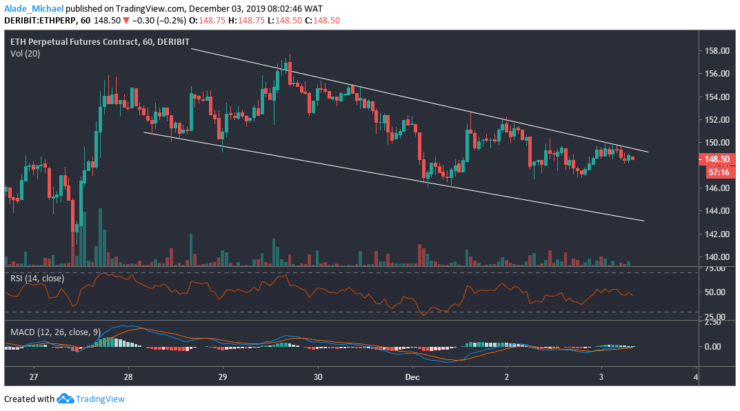
Ethereum has continued to show a sign of weakness on the hourly chart as the market now formed a descending channel which has been shaping since November 28. The sellers are gaining control of the market. Currently, ETH is testing the channel’s upper boundary with a more bearish setup. The key support to watch out for is $146 and $143. It may become heavy if a channel break-down occurs.

However, if Ethereun clearly breaks out of the channel’s upper boundary, the bulls would reclaim the $152 and $156 resistance within a blink of an eye before deciding on the next move. A look on the RSI suggests that the ETH market is under bearish pressure. However, the MACD indicator is about to leave the negative zone. We can expect a breakout if MACD makes a clear bullish crossover.
ETHEREUM BUY SIGNAL
Buy Entry: $148.5
TP: $156.2
SL: 144
- Broker
- Min Deposit
- Score
- Visit Broker
- Award-winning Cryptocurrency trading platform
- $100 minimum deposit,
- FCA & Cysec regulated
- 20% welcome bonus of upto $10,000
- Minimum deposit $100
- Verify your account before the bonus is credited
- Fund Moneta Markets account with a minimum of $250
- Opt in using the form to claim your 50% deposit bonus
Learn to Trade
Never Miss A Trade Again

Signal Notification
Real-time signal notifications whenever a signal is opened, closes or Updated

Get Alerts
Immediate alerts to your email and mobile phone.

Entry Price Levels
Entry price level for every signal Just choose one of our Top Brokers in the list above to get all this free.


