Ethereum (ETH) Price Analysis: Daily Chart – Bearish
Key resistance levels: $150, $159
Key support levels: $140, $133, $125
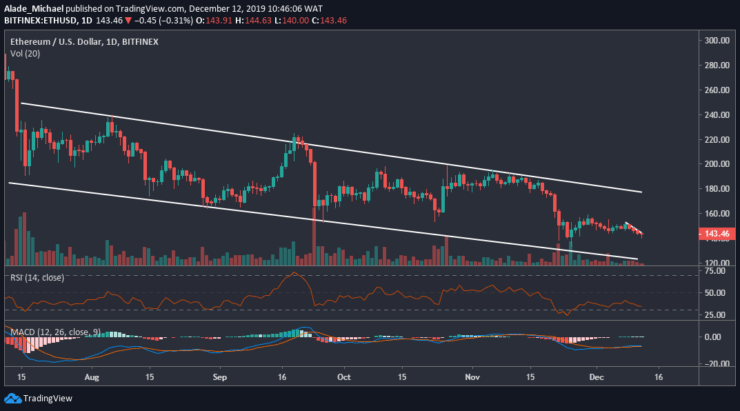
Ethereum is still captured in the six months descending channel on the daily time frame. The price of ETH is more likely to remain under the bear radar until a channel break-up occurs. As of now, Ethereum is forming a bearish pattern which might trigger a price drop to $133 soon, although $140 support is still holding. It would become severe if the bearish extension reaches $125.

In the opposite direction, there’s a close resistance for the buyers at $150, although Ether may reach $159 if the buyers can regroup well. From a technical perspective, the sellers have an upper hand in this trade. From all indications, the price is currently weak on the technical indicators, suggesting that the bears may stay longer in the market than expected.
Ethereum (ETH) Price Analysis: Hourly Chart – Bearish
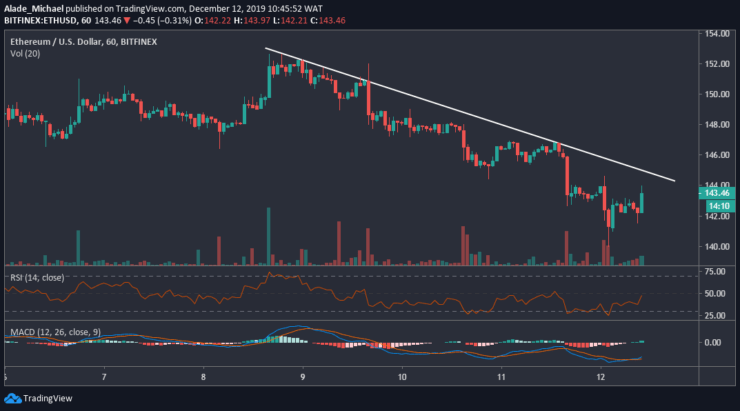
Since December 9, Ethereum has been trading on a downward range with a strong bearish setup on the hourly chart. The weakness in price is causing a lot of bearish scenario in the market. After touching $140 today, Ethereum has managed to recover back to a current price of $143. A possible rejection at $144 is likely to send ETH back to $140. A new weekly low may be created at $137 and $133 if the price drops beneath $140.

On the other hand, Ethereum may resume bullish if the buyers can surpass the white descending trend line. We can expect buying pressure towards the $147, $150 and probably $152 resistance. As shown on the MACD, the ETH market is trying to recover from the negative zone. The RSI is currently facing the 50 levels. Breaking this level would confirm a short-term buy.
ETHEREUM BUY SIGNAL
Buy Entry: $142.5
TP: $149
SL: 139.5
- Broker
- Min Deposit
- Score
- Visit Broker
- Award-winning Cryptocurrency trading platform
- $100 minimum deposit,
- FCA & Cysec regulated
- 20% welcome bonus of upto $10,000
- Minimum deposit $100
- Verify your account before the bonus is credited
- Fund Moneta Markets account with a minimum of $250
- Opt in using the form to claim your 50% deposit bonus
Learn to Trade
Never Miss A Trade Again

Signal Notification
Real-time signal notifications whenever a signal is opened, closes or Updated

Get Alerts
Immediate alerts to your email and mobile phone.

Entry Price Levels
Entry price level for every signal Just choose one of our Top Brokers in the list above to get all this free.


