Binance Coin (BNB) Price Analysis: 4H Chart – Bearish
Key resistance levels: $14.9, $15.5
Key support levels: $14, $13.8
Looking at the 4-hour chart, Binance Coin is trading on the downside with no sign of positive move at the moment. The bearish pattern may cause more pressure towards the $14 support. A drive beneath this support could allow a heavy sell-off to $13.8 support, which is currently acting as the last defence line for the bulls.
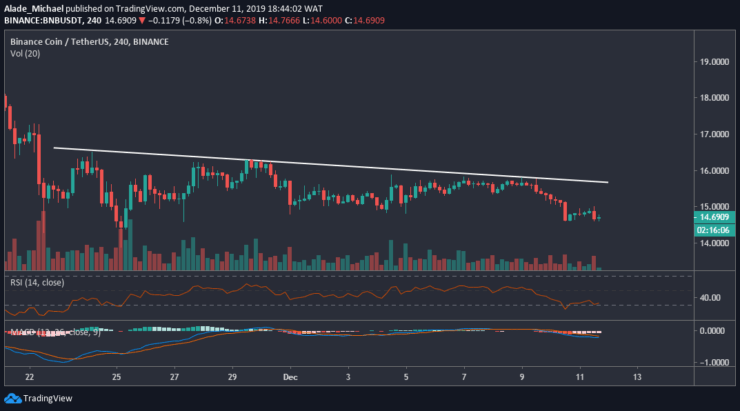
Reclaiming $15.5 could be a bit difficult for the buyers, but $15 appeared to be a close resistance. If BNB manages to climb above the white resistance line, the price is likely to go up. Considering the technical indicators reading, Binance Coin is bearish on both the RSI and the MACD, suggesting that more loss could be around the corner.
Binance Coin (BNB) Price Analysis: Hourly Chart – Bearish
Following yesterday’s quick recovery, Binance Coin is now making a double-bottom pattern around $14.5 support. While deciding on the next important move, a potential rise could send BNB back to $14.9 resistance. A cross above this resistance would confirm a short-term bullish to $15.4 resistance in no time.
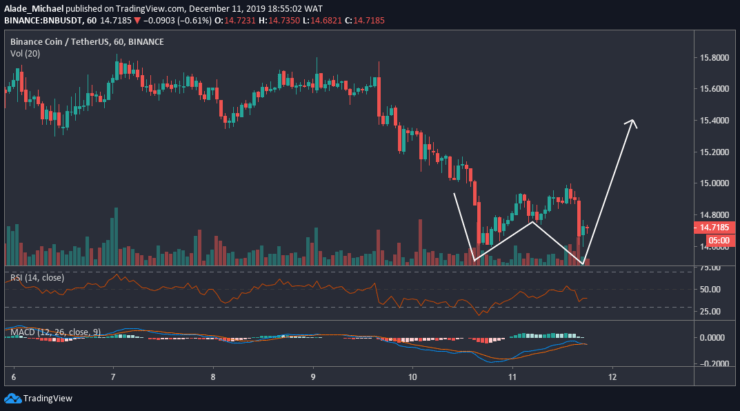
Inversely, we may experience another bearish phase if the downward price shift continues. The current support is $14.5. A break may allow BNB to print a new low at $14. At the time of writing, Binance Coin is forming a bullish pattern on the RSI. We can expect the bulls to take over the market as soon as the MACD produces a bullish crossover. For now, the BNB market is still under bearish control.
BNB BUY SIGNAL
Buy Entry: $15.4
TP: $15.4
SL: 14.4
- Broker
- Min Deposit
- Score
- Visit Broker

- Award-winning Cryptocurrency trading platform
- $100 minimum deposit,
- FCA & Cysec regulated

- 20% welcome bonus of upto $10,000
- Minimum deposit $100
- Verify your account before the bonus is credited
- Fund Moneta Markets account with a minimum of $250
- Opt in using the form to claim your 50% deposit bonus
Learn to Trade
Never Miss A Trade Again

Signal Notification
Real-time signal notifications whenever a signal is opened, closes or Updated

Get Alerts
Immediate alerts to your email and mobile phone.

Entry Price Levels
Entry price level for every signal Just choose one of our Top Brokers in the list above to get all this free.