Key Highlights
Ether breaks the $660 resistance, reaches the high of $757
Ethereum has a target price of $838
Ethereum ETH) Current Statistics
The current price: $744.23
Market Capitalization: $84,886,671,193
Trading Volume: $17,074,355,224
Major supply zones: $800, $820, $840
Major demand zones: $360, $340, $320
Ethereum (ETH) Price Analysis December 30, 2020
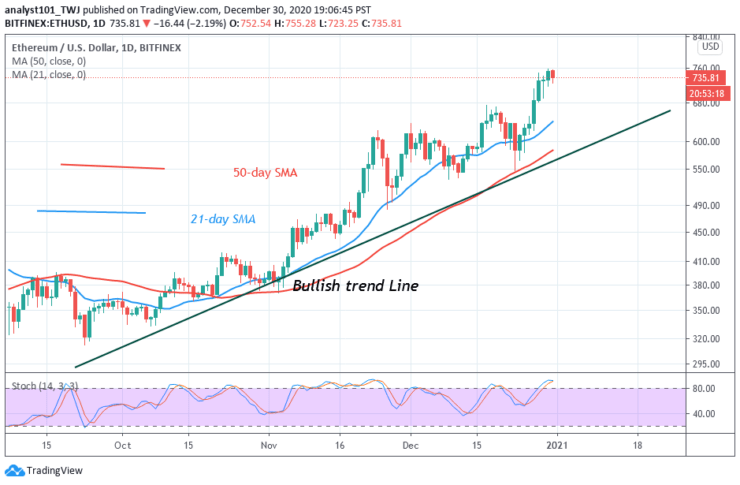
Ethereum bulls have continued to push on the upside as the coin reaches the high of $757. The biggest altcoin faces rejection as it tests the $760 resistance zone.
It is assumed that if it breaks the $760 resistance zone, the coin will attain the $838 price level of April 2018. Conversely, if the bulls fail to break this resistance level, the coin will be compelled to a sideways move. Alternatively, if Ether falls and breaks below $700, the downtrend will resume.
ETH Technical Indicators Reading
Ethereum has continued to remain above the 80% range of the daily stochastic. It indicates that the coin is in the overbought region of the market. In a strong trending market, the overbought condition may not hold. The RSI is at level 68 which indicates that the crypto has no enough room to rally on the upside.
Conclusion
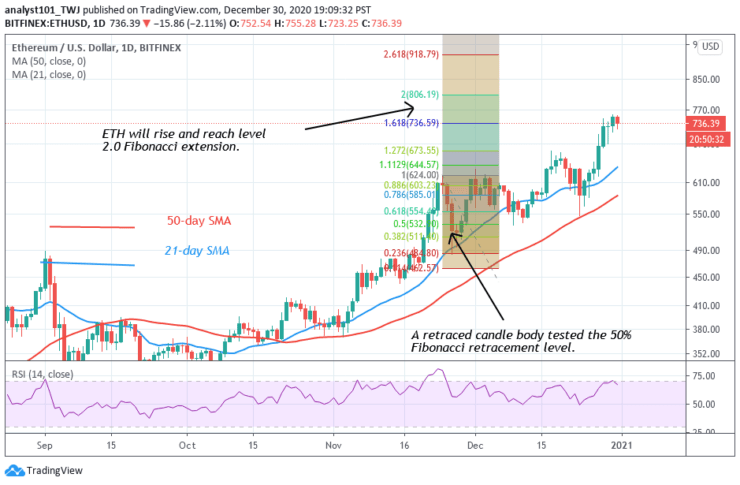
The biggest altcoin is in an upward move. The Fibonacci tool has indicated the upward movement of the coin. The coin has broken the $660 resistance. On November 23 uptrend; a retraced candle body tested the 50% Fibonacci retracement level. It indicates that the market will rise to level 2.0 Fibonacci extensions or the high of $806.19.
Note: Learn2.Trade is not a financial advisor. Do your research before investing your funds in any financial asset or presented product or event. We are not responsible for your investing
- Broker
- Min Deposit
- Score
- Visit Broker

- Award-winning Cryptocurrency trading platform
- $100 minimum deposit,
- FCA & Cysec regulated

- 20% welcome bonus of upto $10,000
- Minimum deposit $100
- Verify your account before the bonus is credited
- Fund Moneta Markets account with a minimum of $250
- Opt in using the form to claim your 50% deposit bonus
Learn to Trade
Never Miss A Trade Again

Signal Notification
Real-time signal notifications whenever a signal is opened, closes or Updated

Get Alerts
Immediate alerts to your email and mobile phone.

Entry Price Levels
Entry price level for every signal Just choose one of our Top Brokers in the list above to get all this free.