Key Highlights
BCH upward move faces another rejection at $380
The altcoin falls to $340 and resumes consolidation between $320 and $360
Bitcoin Cash (BCH) Current Statistics
The current price: $352.23
Market Capitalization: $7,392,791,728
Trading Volume: $4,712,115,752
Major supply zones: $400, $420, $440
Major demand zones: $250, $230, $210
Bitcoin Cash (BCH) Price Analysis December 30, 2020
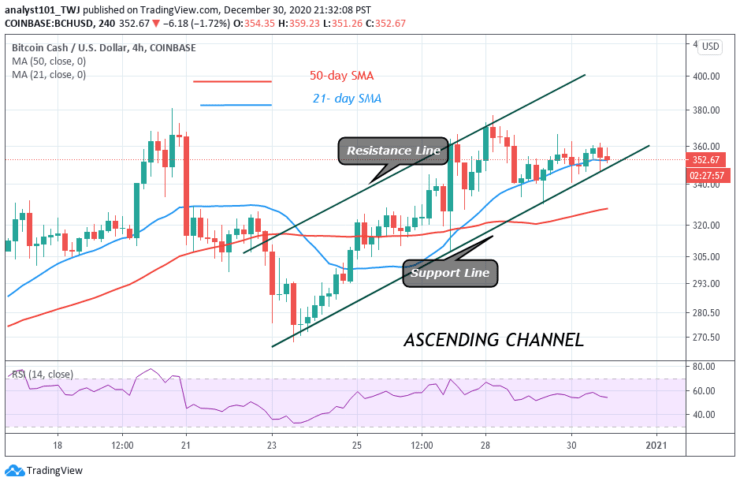
On December 28, BCH retested the $380 overhead resistance and was resisted. The crypto fell to $340 low and resumed consolidation. In the previous price action, BCH plunged to $68 after testing the $380 overhead resistance on December 20. In the meantime, BCH has fallen to $340 low. The crypto is now consolidating between $340 and $360. A strong rebound above the $340 low will break the $360 and $380 resistance levels. A break above the $380 resistance will accelerate price movement on the upside.
Bitcoin Cash Technical Indicators Reading
Bitcoin Cash has fallen to level 53 of the Relative Strength index period 14. It indicates that the coin is in the uptrend zone. The price has broken below the 21-day SMA. A break below the SMAs will suggest a downward movement of the coin.
Conclusion
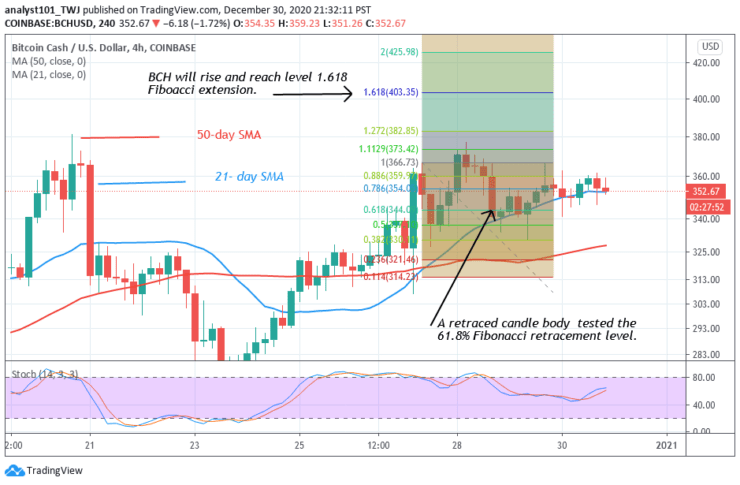
An upward move is likely if the $380 overhead resistance is breached. On December 27 uptrend; the retraced candle body tested the 61.8% Fibonacci retracement level. The retracement indicates that BCH is likely to rise and reach level 1.618 Fibonacci extension. That is the coin will rise to a high of $404.14.
Note: Learn2.Trade is not a financial advisor. Do your research before investing your funds in any financial asset or presented product or event. We are not responsible for your investing results
- Broker
- Min Deposit
- Score
- Visit Broker

- Award-winning Cryptocurrency trading platform
- $100 minimum deposit,
- FCA & Cysec regulated

- 20% welcome bonus of upto $10,000
- Minimum deposit $100
- Verify your account before the bonus is credited
- Fund Moneta Markets account with a minimum of $250
- Opt in using the form to claim your 50% deposit bonus
Learn to Trade
Never Miss A Trade Again

Signal Notification
Real-time signal notifications whenever a signal is opened, closes or Updated

Get Alerts
Immediate alerts to your email and mobile phone.

Entry Price Levels
Entry price level for every signal Just choose one of our Top Brokers in the list above to get all this free.