Key Highlights
Ethereum is struggling below $680 resistance
Ether has a target price of $800
The current price: $625.94
Market Capitalization: $72,044,435,562
Trading Volume: $14,203,783,976
Major supply zones: $280, $320, $360
Major demand zones: $160, $140, $100
Ethereum (ETH) Price Analysis December 21, 2020
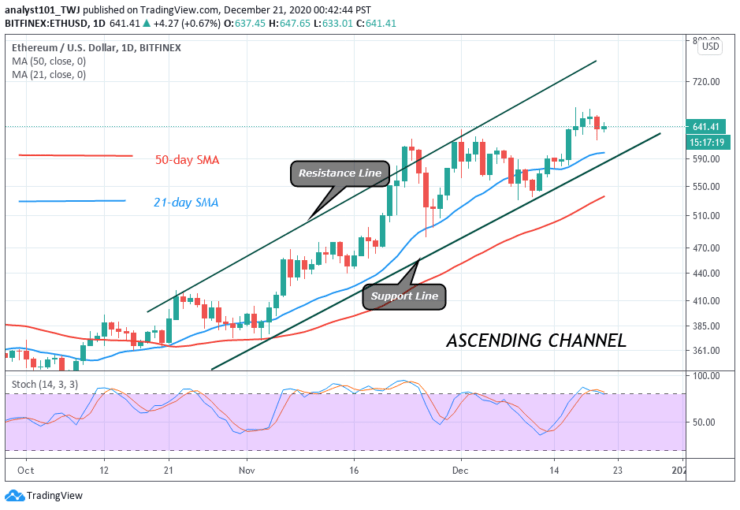
After overcoming the $620 overhead resistance, the biggest altcoin has moved up to $670 high. Presently, the crypto is facing resistance at the recent high as the coin resumes sideways move.
Ether is fluctuating between $620 and $680 as the coin faces resistance from the recent high. On the upside, if the bulls break the current resistance, the coin will attain a target price of $800. This is the historical price of April 2018. The coin may fall if the bears break the $620 support.
ETH Technical Indicators Reading
Ethereum is above the 80% range of the daily stochastic. The coin is in a strong bullish momentum. There are chances of a further upward move. The price is retracing and if it breaks below the SMAs, a downward move will ensue. Ethereum will rise as the price bars are above the SMAs.
Conclusion
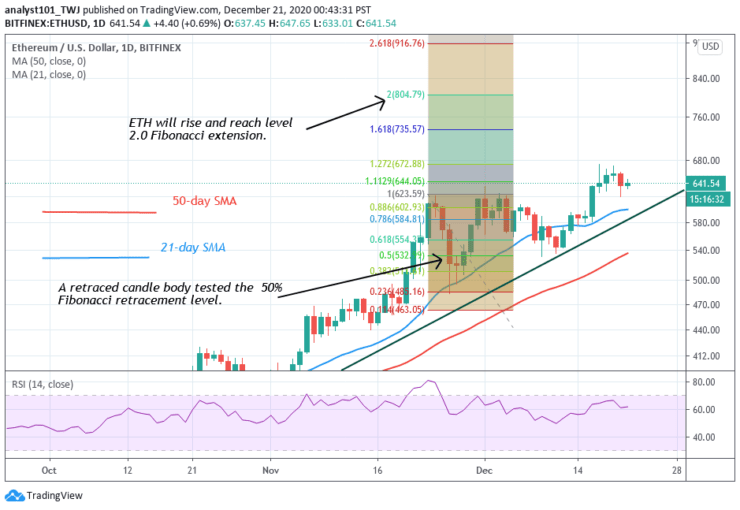
Ethereum has continued to make positive moves as it broke the overhead resistance. The coin is testing the $680 resistance to breaking it. On November 23 uptrend, a retraced candle body tested the 50% Fibonacci retracement level. It indicates that the market will rise to level 2.0 Fibonacci extensions or the high of $804.79
Note: Learn2.Trade is not a financial advisor. Do your research before investing your funds in any financial asset or presented product or event. We are not responsible for your investing
- Broker
- Min Deposit
- Score
- Visit Broker

- Award-winning Cryptocurrency trading platform
- $100 minimum deposit,
- FCA & Cysec regulated

- 20% welcome bonus of upto $10,000
- Minimum deposit $100
- Verify your account before the bonus is credited
- Fund Moneta Markets account with a minimum of $250
- Opt in using the form to claim your 50% deposit bonus
Learn to Trade
Never Miss A Trade Again

Signal Notification
Real-time signal notifications whenever a signal is opened, closes or Updated

Get Alerts
Immediate alerts to your email and mobile phone.

Entry Price Levels
Entry price level for every signal Just choose one of our Top Brokers in the list above to get all this free.