Key Highlights
Ethereum has retraced to $380 low
The coin is consolidating above the current support
Ethereum (ETH) Current Statistics
The current price: $390.07
Market Capitalization: $43,803,253,846
Trading Volume: $9,147,707,922
Major supply zones: $280, $320, $360
Major demand zones: $160, $140, $100
Ethereum (ETH) Price Analysis August 23, 2020
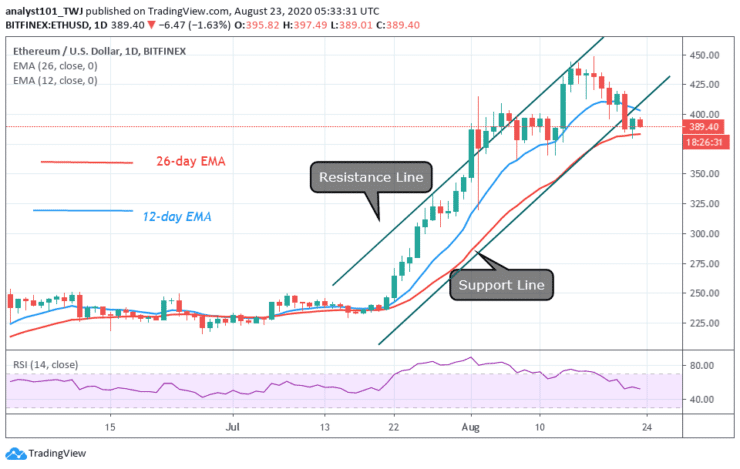
Ethereum is trading at $389 at the time of writing. Since August 21, the coin has been consolidating above $380 support. The current support is holding as sellers are unable to break the support since August 1.
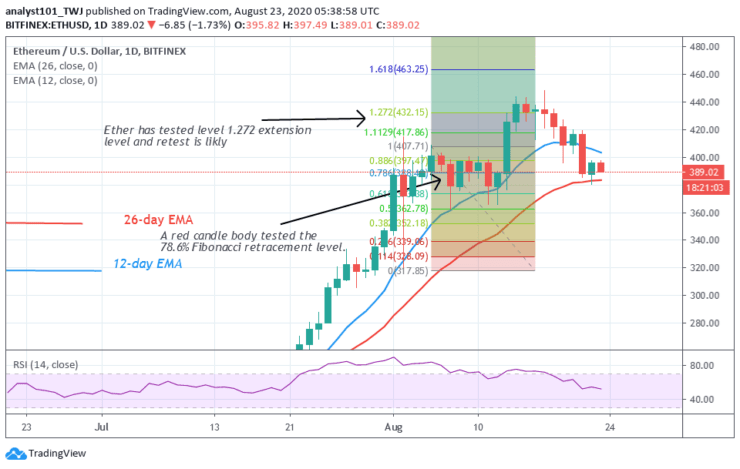
The upward move is likely to resume since the support is holding. A strong bounce above the support will propel the price to resume the upward move. A retest at $440 is likely. If price breaks the resistance, Ether will rise to $480 high. On the other hand, where the bulls fail to break the resistance, ETH may fall or be compelled to a sideways move.
ETH Technical Indicators Reading
Ether price has fallen and found support above 26-day EMA. The downtrend will resume if the price breaks below the EMAs. The coin is at level 52 of the Relative Strength Index period 14. It indicates the price is in the uptrend zone and likely to rise.
Conclusion
For now, the price action is still the same. The coin will rise and retest the $440 resistance. The uptrend is still intact. The volatility is low as the price movement is insignificant. Nonetheless, the crypto is consolidating above $380 support.
- Broker
- Min Deposit
- Score
- Visit Broker

- Award-winning Cryptocurrency trading platform
- $100 minimum deposit,
- FCA & Cysec regulated

- 20% welcome bonus of upto $10,000
- Minimum deposit $100
- Verify your account before the bonus is credited
- Fund Moneta Markets account with a minimum of $250
- Opt in using the form to claim your 50% deposit bonus
Learn to Trade
Never Miss A Trade Again

Signal Notification
Real-time signal notifications whenever a signal is opened, closes or Updated

Get Alerts
Immediate alerts to your email and mobile phone.

Entry Price Levels
Entry price level for every signal Just choose one of our Top Brokers in the list above to get all this free.