Don’t invest unless you’re prepared to lose all the money you invest. This is a high-risk investment and you are unlikely to be protected if something goes wrong. Take 2 minutes to learn more
Price action in the Ethereum Classic (ETC) daily market has gone significantly bullish. This has seen prices ramp upwards over just two trading sessions. However, it appears that price action may have just drawn the attention of bears, who seem to be feeling the heat already.
ETC Statistics
ETC Value Now: $21.70
Ethereum Classic Market Cap: $3B
ETC Circulating Supply: 141,700,282 ETC
Ethereum Classic Total Supply: 210,700,000 ETC
ETC CoinMarketCap Ranking: 25
Major Price Levels:
Top: $21.70, $22.50, and $23.50
Base: $21.00, $20.50, and $20.00

Ethereum Classic Price Action Breaks Through Multiple Resistance Price Levels
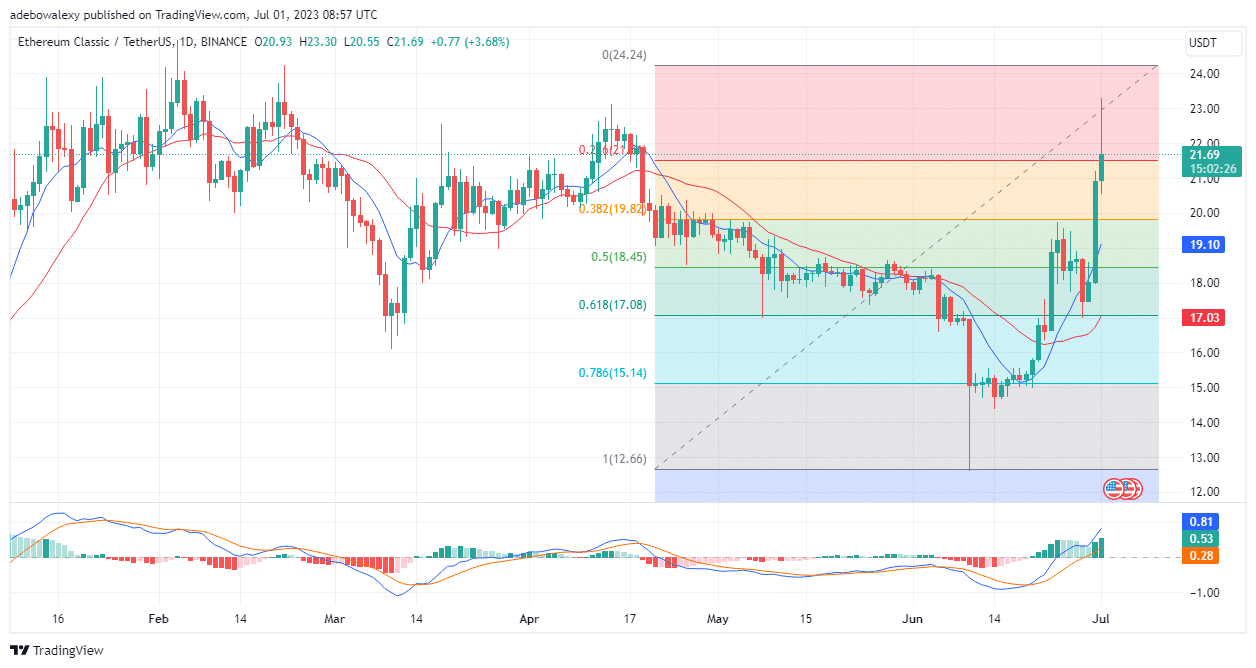
Price movements in the Ethereum Classic daily market ramped through multiple resistance levels at the 50, 38.20, and 23.60 Fibonacci Retracement levels. This all happened over just about three trading sessions.
At this point, the last price candle is above the 9-day Moving Average curve and therefore above the 21-day MA as well. However, the last price candle on this chart seems to be revealing something worth nothing. It can be observed that the wick of the last candle here is quite long.
This seems to show that sellers are exerting a significant effect on price movements. Nevertheless, going by the majority of indications arising from this chart, traders may still expect that price action continues to retrace higher price marks.

Traders May Have Started Going Short in the ETC/USDT Market
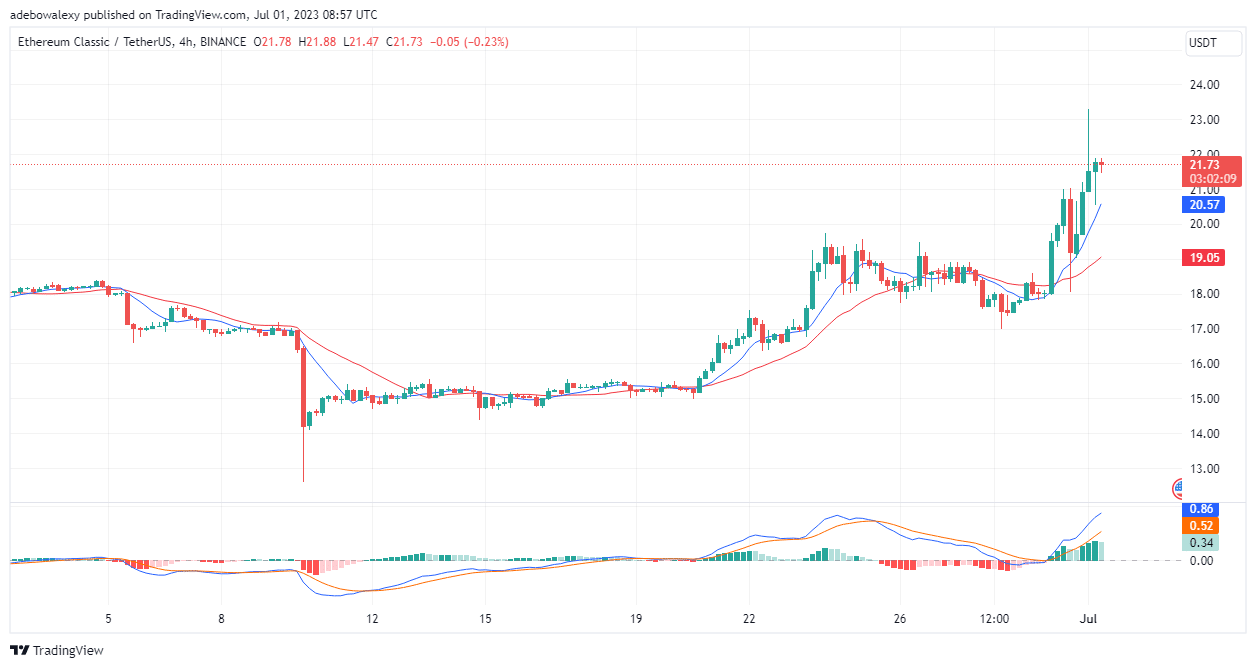
Price action in the ETC/USDT seems to be revealing that traders are already taking advantage of the price surge to go short. Generally speaking, price action, even in this market time frame, seems well positioned for more upside retracement.
However, the last price candlestick on this chart reveals that some sell orders are getting triggered. At this point, this still has a minimal effect on the direction of the market, but it is worth noting. The importance of noting this is further stressed by the Moving Average Convergence Divergence (MACD) indicator.
The MACD indicator seems to be indicating that the upside momentum in this market is weakening. This can be perceived as the last histogram bar on this indicator now appearing pale green. Nevertheless, it is more likely that price action will break the $22.00 mark shortly and may approach the $23.00 mark.
- Broker
- Min Deposit
- Score
- Visit Broker
- Award-winning Cryptocurrency trading platform
- $100 minimum deposit,
- FCA & Cysec regulated
- 20% welcome bonus of upto $10,000
- Minimum deposit $100
- Verify your account before the bonus is credited
- Fund Moneta Markets account with a minimum of $250
- Opt in using the form to claim your 50% deposit bonus
Learn to Trade
Never Miss A Trade Again

Signal Notification
Real-time signal notifications whenever a signal is opened, closes or Updated

Get Alerts
Immediate alerts to your email and mobile phone.

Entry Price Levels
Entry price level for every signal Just choose one of our Top Brokers in the list above to get all this free.


