Ethereum (ETH) Price Analysis – September 30
The Ethereum market is approaching the $177 key resistance again following the last few hours bounce from $166 support. Once more, the market is up with price growth of +3.10%, making ETH to currently trade at around $175. This shows that the buyers are regrouping. We can expect a strong buy if the crypto trading signals a clear break above the key resistance. As of now, ETH remains on a medium-term bearish.
Ethereum (ETH) Price Analysis: Daily Chart – Bearish
Key resistance levels: $177, $190, $200
Key support levels: $164, $154, $150
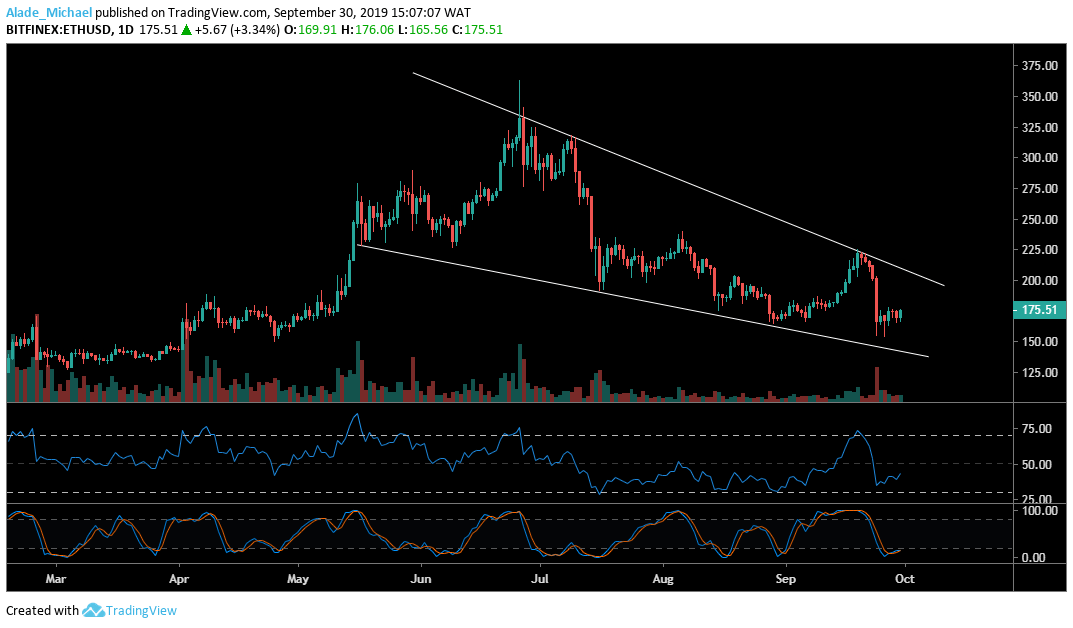
While trading inside a falling wedge pattern, Ethereum is caught in the middle of consolidation for the past six days after establishing support at around $164 on September 24 but has been showing positive move over the last four hours. Now facing potential resistance at $177, the price of ETH may surge to $190 and $200 resistance if the bullish pressure becomes huge.

As we can see, the RSI looks bullish but may face rejection at the 50 level. If such a scenario occurs, we can expect a price fall to $164, $154 and $150 supports. Meanwhile, the crypto trading signals an oversold market on the Stochastic RSI oscillator. Crossing above the 20 level may allow the ETH market to go bullish.
Ethereum (ETH) Price Analysis: 4H Chart – Neutral
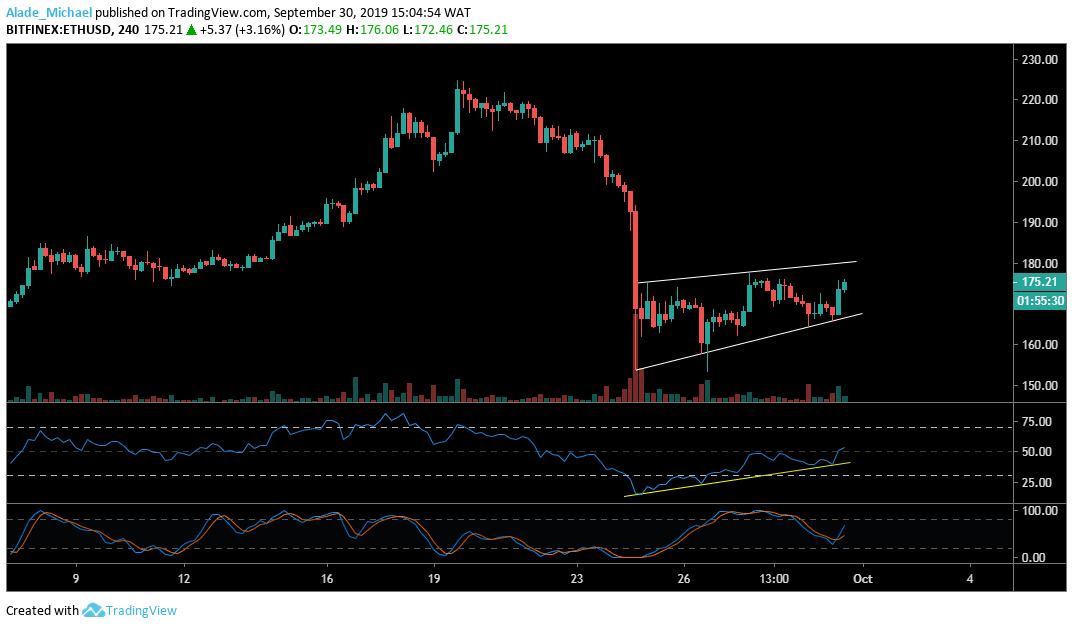
For the past few days, Ethereum is carving a slow rising wedge pattern – suggesting a bearish formation on the 4-hours chart. The bearish formation is most likely to follow a lower lows and lower highs pattern, although the price is turning bullish on the RSI indicator. If Ether can rise above the wedge pattern, the $187 and $193 and $200 resistance may play out.

However, close resistance lies at $177 and $180. As suggested on the Stochastic RSI, Ethereum is shooting up to confirm that the buyers have stepped back in the market. Should selling pressure occurs, the token may roll back to $170 and $164 support. A drive beneath the wedge could lead to a more serious sell-off at $158 and $153 supports.
ETHEREUM BUY SIGNAL
Buy Entry: $173
TP: $179
SL: 170
- Broker
- Min Deposit
- Score
- Visit Broker
- Award-winning Cryptocurrency trading platform
- $100 minimum deposit,
- FCA & Cysec regulated
- 20% welcome bonus of upto $10,000
- Minimum deposit $100
- Verify your account before the bonus is credited
- Fund Moneta Markets account with a minimum of $250
- Opt in using the form to claim your 50% deposit bonus
Learn to Trade
Never Miss A Trade Again

Signal Notification
Real-time signal notifications whenever a signal is opened, closes or Updated

Get Alerts
Immediate alerts to your email and mobile phone.

Entry Price Levels
Entry price level for every signal Just choose one of our Top Brokers in the list above to get all this free.


