Being able to analyse forex charts is a key skill for any trader in the fast-paced world of forex trading. Forex charts help traders spot trends, patterns, and prospective trading opportunities by offering useful information about currency price changes over time.
Tamaño de mi operación
€ 1,000 (0.01 lots)
EUR/USD
Sort By
3Provider that matches your filtersProviders that match your filters
71% of retail investor accounts lose money when trading CFDs with this provider.
You may increase your overall trading performance and make better trade decisions by learning how to successfully comprehend and analyse forex charts. This article will go through the essentials of forex chart analysis and offer helpful advice to help you improve your trading abilities.
In order to comprehend and analyse the movements of currency pairings in the foreign exchange market, forex charts are essential. Traders can make wise selections and carry out winning trades by analysing these charts.
In this post, we’ll examine the significance of forex charts and how to use them wisely when trading.
Why Forex Charts Are Important
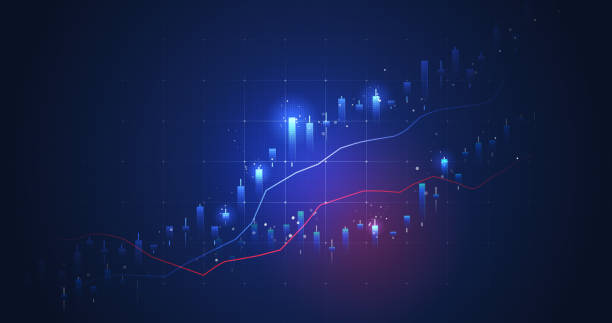
Visual representations of price data for currency pairings over a given time period are provided by forex charts. They offer useful data on a currency pair’s past performance, enabling traders to spot patterns, trends, and prospective trading opportunities. For the following reasons, forex charts are crucial in trading:
Price Analysis: Using forex charts, traders may track the price changes of different currency pairings and estimate where prices will go in the future.
Technical Analysis: The study of past pricing data, patterns, and indications in order to predict market developments includes the use of charts as a key component.
Market Timing: Traders can increase their chances of maximising earnings and minimising losses by analysing forex charts to determine the best entry and exit points for their transactions.
Different Forex Chart Types
There are various sorts of forex charts accessible, and each has advantages and applications of its own. Let’s investigate the most typical chart types:
Line charts. Line charts give a simple representation of a currency pair’s closing prices over time. The closing prices are linked together to create a continuous line that enables traders to see the overall price movement.
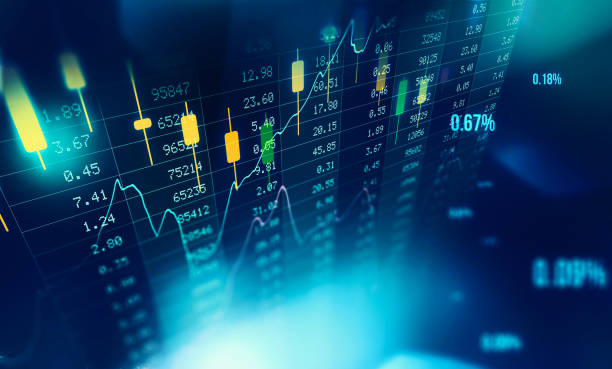
Bar Charts. Bar charts show a wider range of data, such as the high, low, opening, and closing prices for each period. A visual representation of the price range inside each bar’s assigned time interval is also shown.
Candlestick charts. While comparable to bar charts, candlestick charts provide a more aesthetically pleasing display of price data. They are made up of “candlesticks” that stand in for the high, low, opening, and closing prices. Candlestick patterns can assist forecast future price movements and offer insightful information about market mood.
Analyzing Forex Charts
Analyzing forex charts involves examining various elements and patterns to gain insights into market behavior. Here are some key aspects to consider when analyzing forex charts:
Trends. In forex trading, spotting trends is essential. Trends can be bullish (upward), bearish (downward), or range-bound (sideways). Trendlines are frequently used by traders to illustrate and confirm the trend’s direction.
Support and Resistance Levels. Significant price levels that become the focus of buying or selling pressure are known as support and resistance levels. These levels may serve as market obstacles or turning points. Trading decisions and profit targets can be made by traders with the aid of recognizing and utilizing support and resistance levels.
Chart Patterns. Chart patterns can be a useful tool for identifying probable market continuations or reversals. The triangle, head and shoulders, double tops, and double bottoms are a few designs that are frequently seen. Traders can use these patterns to help them locate potential entry and exit locations.
Indicatos. Technical indicators are computations that are applied to pricing data to produce extra insights. Moving averages, the relative strength index (RSI), stochastic oscillator, and MACD (moving average convergence divergence) are some common indicators. Indicators can provide trading signals, help confirm trends, and spot overbought or oversold conditions.
Tips for Successful Forex Chart Analysis
To improve their abilities and decision-making, traders can use the following advice to execute efficient forex chart analysis:
Establish a Clearly Defined Trading Strategy. It is essential to have a clearly defined trading strategy before beginning to analyze charts. Choose the currency pairings you wish to concentrate on after determining your trading objectives, risk tolerance, and chosen trading method (such as scalping, day trading, or swing trading). Your chart analysis will be more in line with your overall trading goals if you have a clear trading plan.
Use Multiple Timeframes. To get a full picture of the market, analyze forex charts over a variety of timeframes. Start with a longer timeframe (daily or weekly, for example) to spot long-term trends, significant levels of support and resistance, and general market sentiment. Then, zoom in closer for more accurate entrance and exit points to smaller timeframes (such as hourly or 15-minute). Analysis across many timeframes offers a comprehensive viewpoint and supports the confirmation of trade recommendations.
Master Candlestick Patterns. Candlestick patterns provide insightful information about the mood of the market as well as prospective reversals or continuations. The popular candlestick patterns doji, engulfing patterns, hammer, shooting star, and others should be learned and become familiar with. Recognize each pattern’s significance and how it connects to price behavior. Your chart analysis accuracy can be improved by combining candlestick patterns with other technical analysis tools.
Combine Technical Indicators. When examining forex charts, technical indicators might offer extra validation and insights. To test your research and find suitable entry and exit points, experiment with several indicators like as moving averages, oscillators (RSI, stochastic), or MACD. Nevertheless, avoiding overstuffing your charts with indications might help prevent confusion. Concentrate on a few indications that support your trading approach.
Practise and Learn
Consider Market News and Events. Keep up with economic news releases, geopolitical developments, and central bank statements as they can have a big impact on the FX market. These occurrences have the potential to cause abrupt volatility and affect price changes. To have a complete grasp of the market, combine chart analysis with fundamental analysis. Use an economic calendar to keep track of significant events and adjust your trading strategy as necessary.
Employ Risk Management Techniques: A thorough review of charts should always be complemented by appropriate risk management strategies. Set stop-loss orders to prevent further losses, calculate your risk-to-reward ratio for each trade, and size your positions appropriately based on your account balance and risk tolerance. A considerable amount of your capital should not be put at risk in a single trade because doing so can result in significant losses.
Keep a Trading Journal. To keep track of your chart analysis, trades you make, and their results, keep a trading notebook. To find trends, strengths, and places for development, go back and read your diary frequently. You may improve your chart analysis abilities over time by looking back on your previous transactions and considering your choices.
Continue to learn and adapt. Because the forex market is dynamic, chart analysis methods must change to reflect shifting market dynamics. Keep up with market developments, participate in webinars or seminars, and study instructional materials to increase your understanding. Your analysis techniques should be modified as necessary to reflect changing market conditions.
Always keep in mind that successful forex chart analysis involves practise, perseverance, and dedication. Making informed trading decisions requires integrating technical analysis with fundamental analysis, risk management, and other factors.
Your abilities in chart analysis will advance with practise and time, resulting in more profitable trades in the forex market.
Disadvantages of Forex Charts
Although forex charts are useful resources for examining price changes and making wise trading decisions, they also have some restrictions and disadvantages.
To successfully navigate the world of forex chart analysis, traders must be aware of these drawbacks. The following are some typical drawbacks of forex charts.
Historical Data. Historical price data on forex charts reflects previous market behaviour. Although historical data can shed light on trends and patterns, it cannot predict how prices will move in the future. As a result, relying simply on historical data may not reflect the most recent market dynamics. Market conditions can change quickly.
Lagging Indicators. Lagging indicators make up a large portion of the technical indicators used in forex chart analysis. They produce indications after a trend or price change has already taken place and are based on historical pricing data. Lagging indicators might produce delayed signals, which would prevent traders from taking advantage of possible entry or exit positions.
Subjectivity in Interpretation. Interpreting forex charts requires judgement and subjectivity in analysis. The same chart may be interpreted differently by traders, resulting in various trading decisions. This subjectivity may increase uncertainty and make it difficult to reach an agreement while analysing charts.
Overlapping Patterns. Forex charts frequently display several patterns at once, which can make it challenging to correctly comprehend the signals. Conflicting signals and confusion may result from overlapping patterns, so traders should use caution and weigh additional considerations before making trading decisions.
Signals and Limitations
Limited Context. A limited perspective of the whole market context is offered by forex charts. Although they display price changes, they could miss fundamental elements, geopolitical developments, or market-moving news. Ignoring the bigger picture can result in a lacklustre analysis and higher trading risks.
False Signals. Forex charts are susceptible to fakeouts or false signals. A chart pattern or indicator may suggest a particular price movement to a trader, but the market may act differently, causing unanticipated losses. False signals frequently occur when the market is erratic or volatile.
Technical Analysis Limitations. Technical analysis techniques, which are widely used in forex charts, have their own set of restrictions. Technical analysis makes the assumption that past price trends and indicators can forecast future price changes. Nevertheless, elements other than technical analysis, including as economic statistics, political developments, and market mood, can have an impact on market dynamics.
Time-consuming. For traders who strongly rely on technical analysis, conducting in-depth forex chart research can be time-consuming. Analysis of many periods, currency pairs, and indicators involves a lot of effort and focus. To do adequate analysis, traders must spend enough time, which may not always be possible for individuals with restricted availability.
Despite these drawbacks, forex charts continue to be a useful resource for traders. Other types of analysis, such as fundamental analysis, news monitoring, and risk management strategies, should be used in addition to chart analysis.
Additionally, traders should be aware of the limitations of forex charts and regularly change their techniques and approaches based on market conditions.
Conclusion
For traders to analyse price changes, spot trends, and make wise trading decisions, forex charts are essential tools. Although they have their limitations, forex charts can be used effectively by traders if they are aware of their advantages and disadvantages. Here is a rundown of the main ideas raised.
Forex charts offer historical price information that traders can use to spot trends and patterns, but they cannot predict how prices will move in the future. Instead of relying simply on past data, traders should take into account the current state of the market.
On forex charts, technical indicators and chart patterns help to confirm trends and produce trading signals. The use of overlapping patterns and lagging indicators, which might produce delayed or contradicting indications, must be avoided by traders.
Forex chart interpretation requires subjective analysis, which can lead to a variety of interpretations and trading choices. Traders should improve their abilities, mix several types of analysis, and, if possible, look for agreement.
The greater market backdrop, which includes fundamental reasons, news releases, and geopolitical events, cannot be fully captured by forex charts. Ignoring these elements can result in insufficient analysis and higher trading risks.
In forex charts, false signals and fakeouts can happen, particularly in choppy market conditions. Before placing trades, traders should use caution and confirm signals with extra variables.
In conclusion, forex charts are effective instruments that offer insightful information about price changes and trends. Traders can improve their analysis by using a variety of approaches, taking the larger market environment into account, and engaging in risk management.
Despite the limits of forex charts, traders who approach them with knowledge, competence, and an awareness of their limitations can effectively use them to improve trading decisions.
Share with other traders!
Deposit $250 with Avatrade to get lifetime access to our VIP Signals
Trade on MT4 with Leverage up to 1:500! Trade on MT4 with Leverage up to 1:500!
X
We use cookies to ensure that we give you the best experience on our website. If you continue to use this site we will assume that you are happy with it.


 Up to 15 signals daily
 Most popular
 Up to 15 signals daily