

In the medium term, DYDX/USDT traded within the range of $2.200 and $2.050. However, about four trading sessions ago, price action in this market crashed through the support at $2.050 to push an important support level near the $1.850 price mark. As a result, an upside rebound occurred in this market.
DYDX Statistics:
dYdX Value Now: $2.058
DYDX Market Cap: $319,499,470
DYDX Circulating Supply: 156,256,174 DYDX
dYdX Total Supply: 1,000,000,000 DYDX
DYDX CoinMarketCap Ranking: 32
Major Price Levels:
Top: $2.058, $2.100, and $2.150
Base: $2.008, $1.950, and $1.900
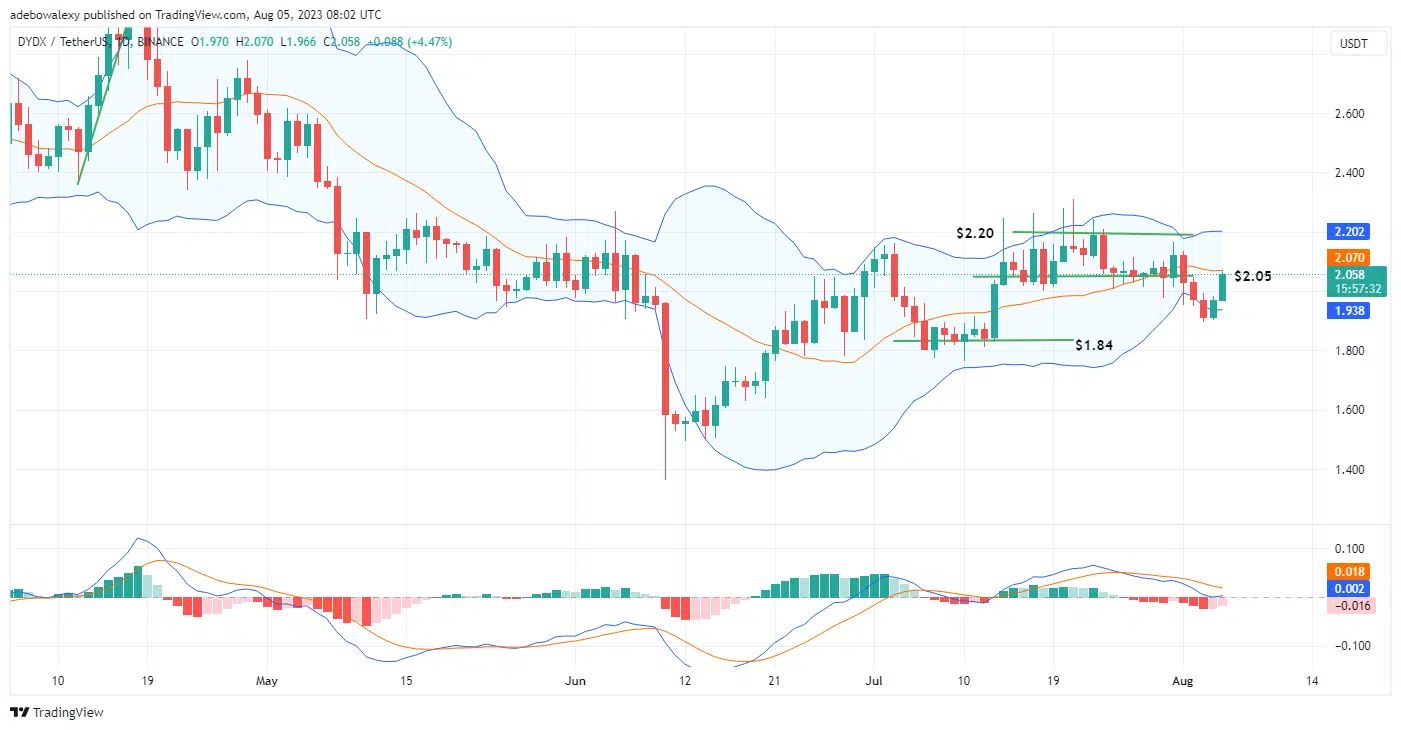
DYDX/USDT Pumps Through the Ceiling at the $2.050 Price Level
As earlier mentioned, price action in the DYDX/USDT market has experienced a significant price increase today, following that of yesterday. At this point, the last price candle in the dYdX daily market has piped through the $2.050 resistance. Also, this price candle has started testing the middle band of the Bollinger Bands.
The Moving Average Convergence Divergence (MACD) indicator prepares a bullish crossover just above the equilibrium level. Consequently, this suggests that bullish momentum is increasing. Nevertheless, the bulls will have to deliver more thrust to finally effect a bullish crossover and a further price increase.

DYDX/USDT Looks Set to Extend Upside Gains
However, the uppermost limit of the Bollinger Bands has been pushed. Consequently, this has resulted in reduced volatility in price action. Nevertheless, traders can anticipate that dYdX may still rise toward the $2.120 price mark.


