

$COIN (NASDQ: COIN) Forecast: May 17
Amid the recent growth in the stock market, the NASDAQ: COIN buyers provided a bullish breakout and established a solid base at the $264.49 high level, paving the way for further recovery. Despite the bullish outlook of the market, bulls are seemingly struggling to uphold the uptrend at the mentioned supply and remain stable at the moment. Therefore, if the stock price could sustain above the pattern supply trend line at the $306.00 previous high point, the price may trigger up to the overhead resistance mark at the $349.75 upper resistance level, bolstering the $COIN growth in the stock market amid renewed buying momentum.
Key Levels:
Resistance Levels: $298.00, $299.00, $300.00
Support Levels: $165.00, $164.00, $163.00
$COIN Long-term Trend: Bullish (Daily Chart)
$COIN market is bullish on the daily chart. The stock price establishes a solid base and remains a good buy at the $264.49 high level above the moving average, approaching the upper resistance level. 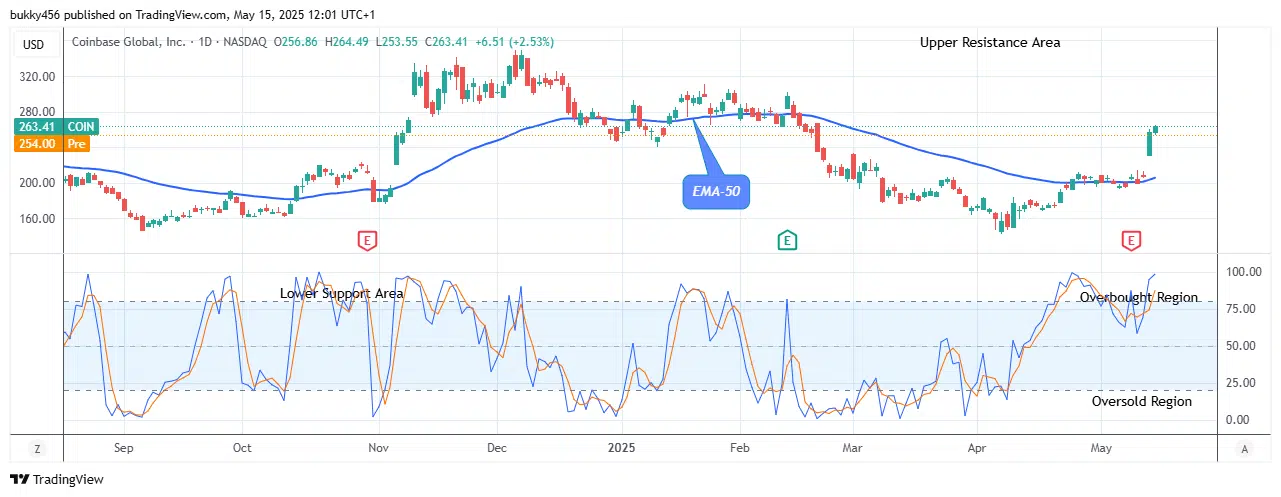
As a result, buyers might swing the stock price to a high of $350.00 in the coming days in its long-term view.
$COIN Medium-term Trend: Bullish (4H Chart)
Today, the NASDAQ stock market looks promising as it establishes a solid base above the resistance levels amid soaring network activity on the medium-term outlook. 
The bullish impact on the stock price at the $260.42 high level in the last action has contributed to its buy trade set-up in its recent high.
The NASDAQ: COIN bulls made an aggressive move and a solid base to the $264.49 resistance level above the EMA-50 shortly after the 4-hourly chart opened today, suggesting an improved bullish market sentiment.
The stock market is currently experiencing a post-rally pullback. If the bullish turnaround breaks above the $302.40 prior barrier point, buyers might strengthen their grip over this asset towards the overhead region, putting the stock trade more on the buying side.
Additionally, continuation to the upside is likely as the price indicator projects an upward move, implying that the bullish trend will continue and the pattern might hit the $350.00 upper resistance trend line in the coming days, indicating a potential buy signal in its medium-term view.
Make money without lifting your fingers: Start trading smarter today


