
Key Highlights
LINK may further decline to $3.50 low
The crypto faces rejection at $10.50
Chainlink (LINK) Current Statistics
The current price: $9.98
Market Capitalization: $3,491,684,205
Trading Volume: $2,402,386,922
Major supply zones: $18.00, $20.00,$22.00
Major demand zones: $8.00, $6.00, $4.00
Chainlink (LINK) Price Analysis September 25, 2020
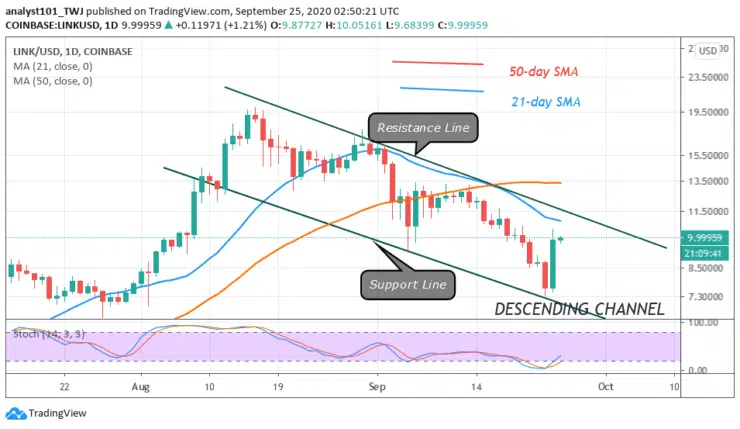
Yesterday, LINK continues its downward move as it fell to the low of $7.30 and resumed an upward move. The upward move was a strong bounce above the current support. The price momentum was not sufficient to break the resistance line of the descending channel. The market is facing resistance at the recent lower highs. The coin will continue lower highs and lower lows if rejected at the recent high. In other words, LINK will further decline below $3.50.
Chainlink Technical Indicators Reading
The price has been rejected by the 21-day SMA. The implication is that the coin will fall and continue the downward move. LINK is below the 20% range of the daily stochastic. It indicates that the coin is in the oversold region of the market. Soon buyers are likely to emerge to push prices upward.

Conclusion
LINK price is falling after the recent rejection at $10.50. On September 5 downtrend; a green retraced candle body tested the 61.8% Fibonacci retracement level. It implies that the coin will fall and reach the 1.618 Fibonacci extension level. That is a low of $3.50.
Note: Learn2.Trade is not a financial advisor. Do your research before investing your funds in any financial asset or presented product or event. We are not responsible for your investing results


