Key Highlights
LINK faces rejection at the $11 resistance
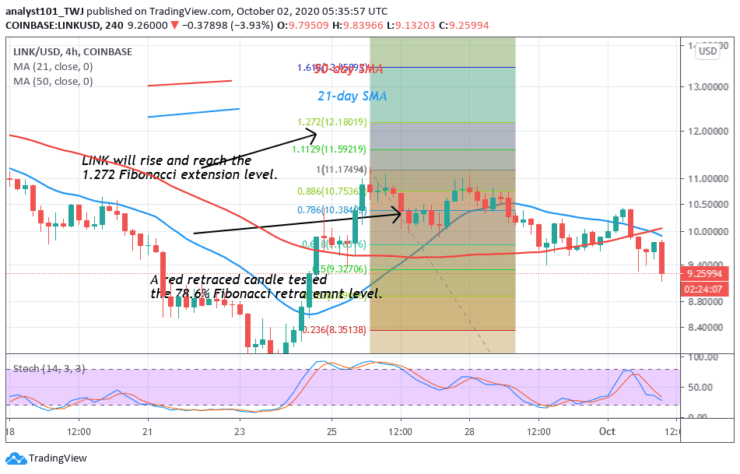
The crypto targets the high of $12.18
Chainlink (LINK) Current Statistics
The current price: $9.34
Market Capitalization: $3,270,066,508
Trading Volume: $1,394,609,318
Major supply zones: $18.00, $20.00,$22.00
Major demand zones: $8.00, $6.00, $4.00
Chainlink (LINK) Price Analysis October 2, 2020
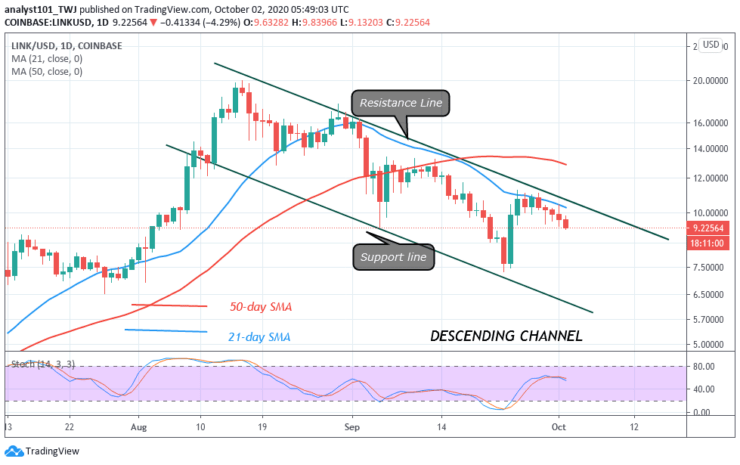
LINK rebounded as it reached a low of $7.50. However, the rebound reached a high of $11.00 but was rejected. The price has retraced to a low of $9.66 at the time of writing. Nevertheless, if buyers push prices above $14 high, the downward correction will be ended. The coin will resume upside momentum. Today, the coin has fallen to the $9.66 low and buyers are attempting to resume upward.
Chainlink Technical Indicators Reading
LINK is at level 42 of the Relative Strength Index period 14. It indicates that price is in the downtrend zone and below the centerline 50. The price is below the EMAs which suggests that price will fall.
Conclusion
LINK has chances of a further upward move once it breaks the $11 resistance. On the September 25 uptrend, the coin reached a high of $11 but was resisted. The retraced candle body tested the 78.6 % Fibonacci retracement level. It indicates that the market will reach the 1.272 Fibonacci extension level or the high of $12.18.
Note: Learn2.Trade is not a financial advisor. Do your research before investing your funds in any financial asset or presented product or event. We are not responsible for your investing results
- Broker
- Min Deposit
- Score
- Visit Broker

- Award-winning Cryptocurrency trading platform
- $100 minimum deposit,
- FCA & Cysec regulated

- 20% welcome bonus of upto $10,000
- Minimum deposit $100
- Verify your account before the bonus is credited
- Fund Moneta Markets account with a minimum of $250
- Opt in using the form to claim your 50% deposit bonus
Learn to Trade
Never Miss A Trade Again

Signal Notification
Real-time signal notifications whenever a signal is opened, closes or Updated

Get Alerts
Immediate alerts to your email and mobile phone.

Entry Price Levels
Entry price level for every signal Just choose one of our Top Brokers in the list above to get all this free.