Don’t invest unless you’re prepared to lose all the money you invest. This is a high-risk investment and you are unlikely to be protected if something goes wrong. Take 2 minutes to learn more
The Cartesi daily market has seen a minimal upward rebound at a time when Bitcoin continues to dip. This has been pulling other altcoins down, and not many have been seeing significant gains. Let’s explore how things may develop below.
Cartesi Statistics
CTSI Current Price: $0.0478
Market Capitalization: $41.23M
Circulating Supply: 863.44M
Total Supply: 1B
CoinMarketCap Rank: 486
Key Price Levels
Resistance: $0.0500, $0.0800, $0.1000
Support: $0.0400, $0.0300, $0.0200
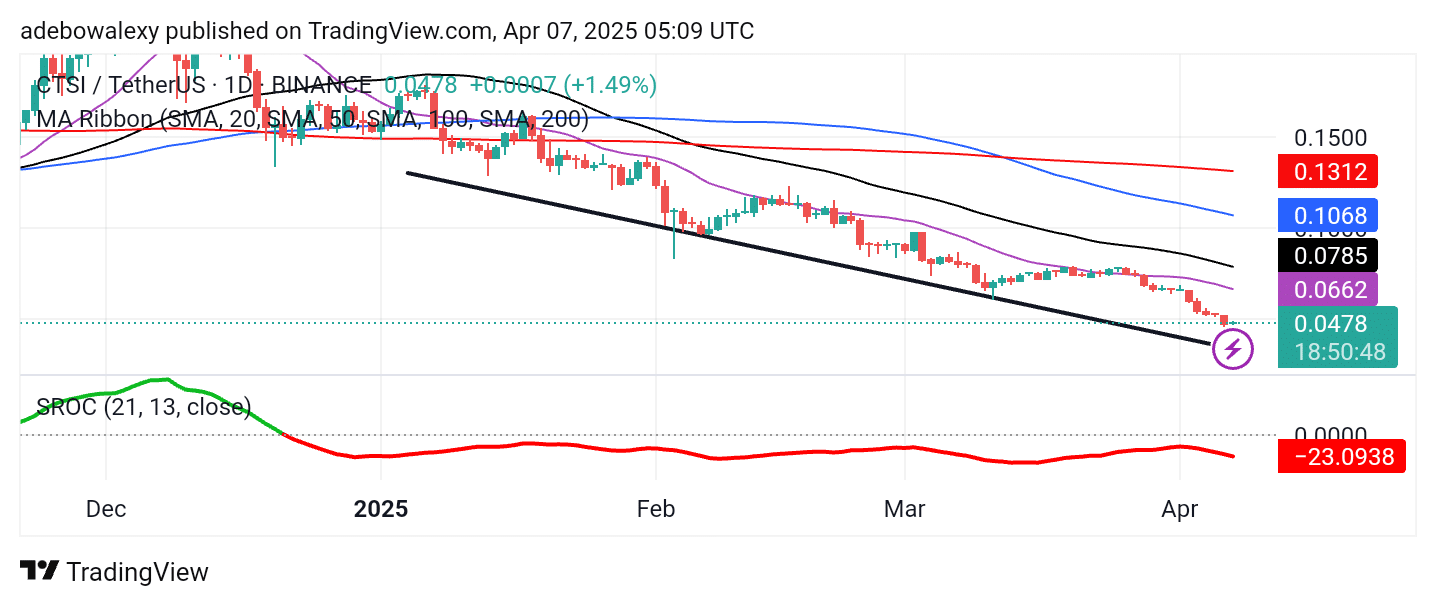
CTSI Maintains a General Downtrend
Looking at the Cartesi daily chart, it can be seen that the market is in a downtrend. This downward correction has roots in the previous year and has steadily continued.
As a result, price activity in this market has remained below most of the Moving Average lines, and not much upward retracement has been observed. However, the ongoing session seems to have produced a slight upward rebound, even as bearish momentum remains strong in the general crypto market.
The Stochastic Rate of Change (ROC) indicator line is below the equilibrium level, further affirming the strong bearish sentiment in this market. The smooth downward trajectory of this indicator line reinforces this outlook.
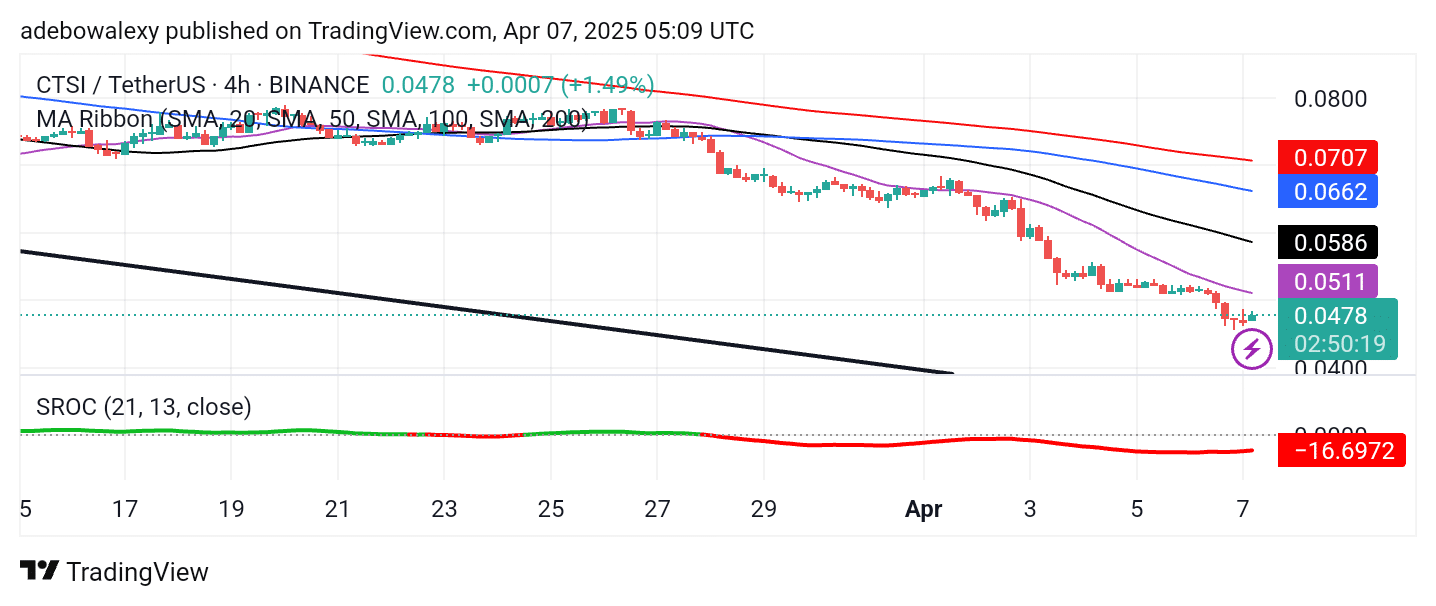
Cartesi Bulls Remain Overwhelmed
On the CTSI 4-hour chart, price action continues to be under a strong bearish influence. The latest price candle on this chart is green, suggesting that the recent price increase occurred during the most recent four-hour session. However, price action remains consistently below all the MA lines. Similarly, the Stochastic ROC lines remain below the equilibrium level.
Due to the recent gains, the terminal end of the Stochastic ROC indicator line is tilted slightly upwards. Nevertheless, considering the general trend, this market is likely to proceed downward toward the $0.0450 and $0.0400 price levels.
Make money without lifting your fingers: Start trading smarter today
- Broker
- Min Deposit
- Score
- Visit Broker

- Award-winning Cryptocurrency trading platform
- $100 minimum deposit,
- FCA & Cysec regulated

- 20% welcome bonus of upto $10,000
- Minimum deposit $100
- Verify your account before the bonus is credited
- Fund Moneta Markets account with a minimum of $250
- Opt in using the form to claim your 50% deposit bonus
Learn to Trade
Never Miss A Trade Again

Signal Notification
Real-time signal notifications whenever a signal is opened, closes or Updated

Get Alerts
Immediate alerts to your email and mobile phone.

Entry Price Levels
Entry price level for every signal Just choose one of our Top Brokers in the list above to get all this free.