ADA Price Analysis – September 13
Should sellers exert more pressure, ADA may decrease to break down $0.47, the next support levels can be found at $0.41, and $0.38 levels. When the buyers interrupt the sellers, and the daily candle close above $0.50 level, Cardano may increase to $0.54 and $0.58 levels.
ADA/USD Market
Key Levels:
Resistance levels: $0.50, $0.54, $0.58
Support levels: $0.47, $0.41, $0.38
ADA/USD Long-term Trend: Bearish
On the daily chart, Cardano is bearish. The price action has formed a descending channel in the daily chart as an evidence of bearish signal. Cardano touched the support level of $0.41 twice. The first touch was on July 12 and the second touch was carried out on August 26. This scenario is a bearish movement signal. Strong daily bullish candles were produced and the price increases. The resistance level of $0.47 was broken upside. The price is currently repelling from the resistance level of $0.50. The lower trend line may be tested.
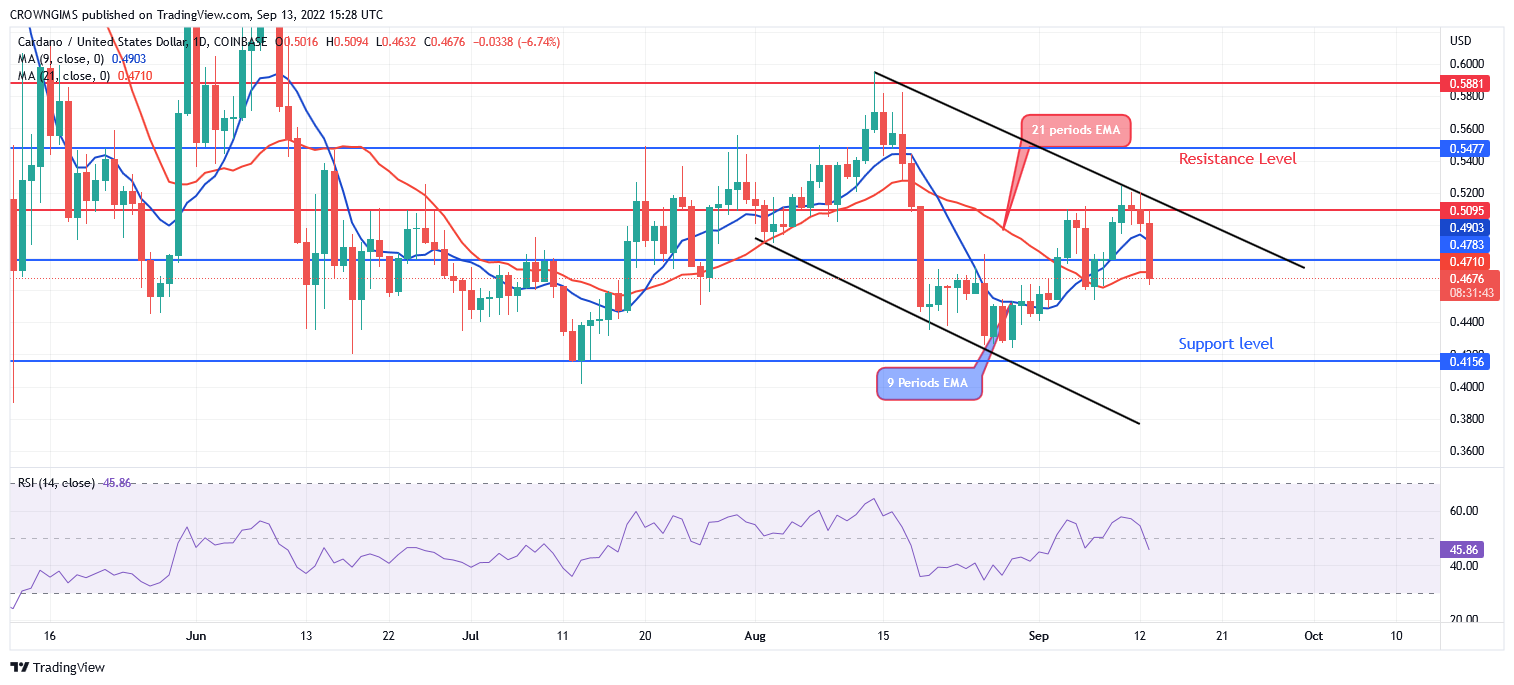
The price is trading below the two dynamic resistance levels of 9 periods EMA and 21 periods EMA at close distance indicating bearish momentum. Should sellers exert more pressure, ADA may decrease to break down $0.47, the next support levels can be found at $0.41, and $0.38 levels. When the buyers interrupt the sellers, and the daily candle close above $0.50 level, Cardano may increase to $0.54 and $0.58 levels. The technical indicator Relative Strength Index is at 54 levels with the signal line pointing downside which indicates a bearish signal.
ADA/USD Medium-term Trend: Bearish
Cardano is bearish on 4-hour chart. The Crypto was heading towards the support level of $0.41 before buyers opposed the movement. Strong sellers’ pressure is noticed on the 4-hour chart; formation of big bearish candle which placed the price below $0.50 support level. At the moment the price is pulling back.
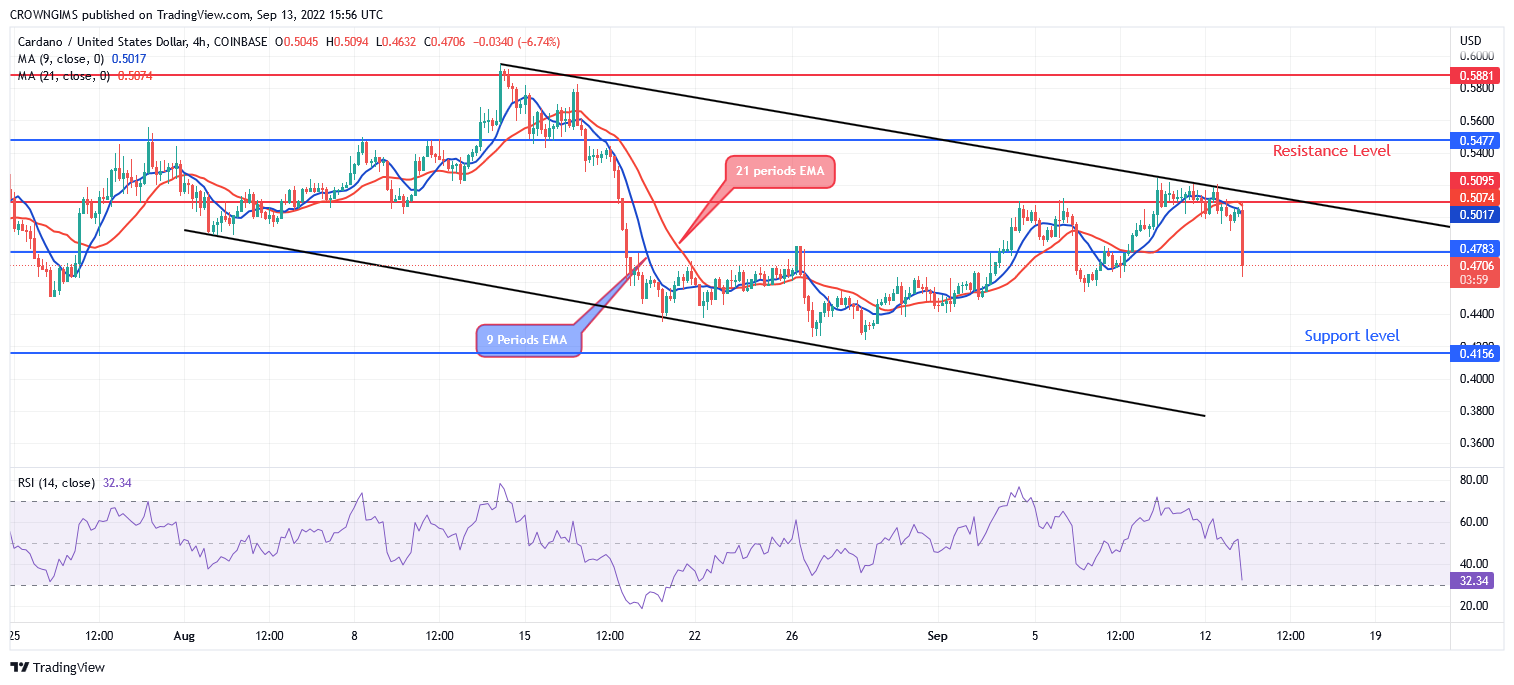
The 9 periods EMA crossed the 21 periods EMA downside indicating that bears are trying to dominate Cardano market. The relative strength index period 14 is pointing downside at 48 levels indicating sell signal.
You can purchase crypto coins here: Buy LBLOCK
- Broker
- Min Deposit
- Score
- Visit Broker

- Award-winning Cryptocurrency trading platform
- $100 minimum deposit,
- FCA & Cysec regulated

- 20% welcome bonus of upto $10,000
- Minimum deposit $100
- Verify your account before the bonus is credited
- Fund Moneta Markets account with a minimum of $250
- Opt in using the form to claim your 50% deposit bonus
Learn to Trade
Never Miss A Trade Again

Signal Notification
Real-time signal notifications whenever a signal is opened, closes or Updated

Get Alerts
Immediate alerts to your email and mobile phone.

Entry Price Levels
Entry price level for every signal Just choose one of our Top Brokers in the list above to get all this free.