Should the buyers gain enough momentum and the daily candle closes above $0.34 level, ADA/USD may increase to $0.38 – $0.45. In case the sellers defend the $0.34 level, the bears’ pressure may likely reduce the price. However, the next support levels can be found at $0.27, $0.24, and $0.21.
ADA/USD Market
Key Levels:
Resistance levels: $0.34, $0.38, $0.45
Support levels: $0.27, $0.24, $0.21
ADA/USD Long-term Trend: Bullish
ADA/USD was exhibiting a range-bound movement within $0.19 and $0.13 price level till January 02. The buyers gathered enough momentum to break up the resistance level of $0.19 on January 03; this is seen on the daily chart with the formation of strong bullish candles. The resistance level of $0.19 was penetrated and the price continues increasing towards the resistance level of $0.34. The just mentioned level was tested on January 06 and the price could not break the level but pulls back.
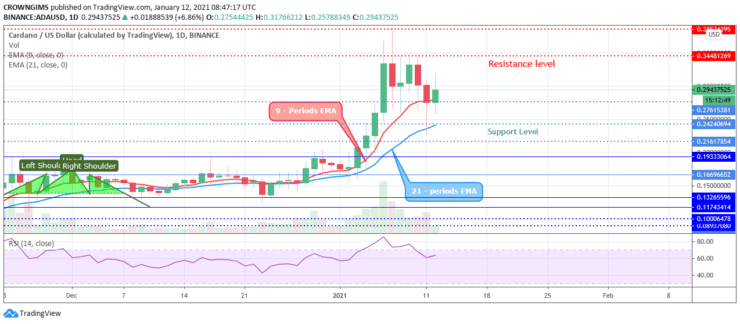
Should the buyers gain enough momentum and the daily candle closes above $0.34 level, ADA/USD may increase to $0.38 – $0.45. In case the sellers defend the $0.34 level, the bears’ pressure may likely reduce the price. However, the next support levels can be found at $0.27, $0.24, and $0.21. The technical indicator RSI is above 60 levels with the signal line pointing upside which indicates a bullish signal.
ADA/USD Medium-term Trend: bullish
Cardano is on the bullish movement on the 4-hour chart. The crypto tested the resistance level of $0.34 on January 07 after it breaks out of the consolidation mode. It pulled back and retested $0.27 level. The second touch at $0.34 level was on January 09 pulled back again and tested $0.24 level last week. The just mentioned level rejected the price and seems to continue bullish trend.
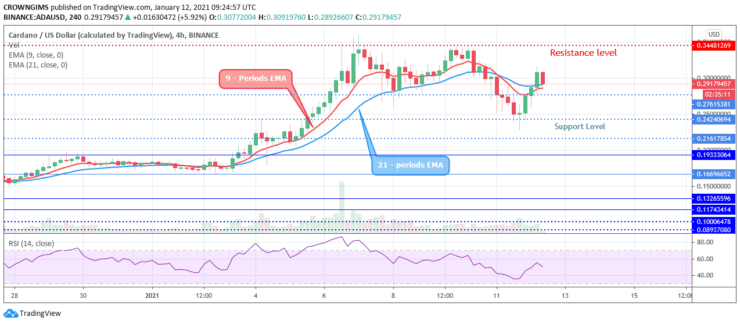
The 9 periods EMA is crossing the 21 periods EMA upside and the price is trading over the two EMAs as a sign of bullish movement while the relative strength index period 14 is at 50 levels and the signal line shows sell signal which may be a pullback.
It is advisable to place Buy Stop at $0.3101, take profit at $0.3777, and stop-loss at $0.2730.
- Broker
- Min Deposit
- Score
- Visit Broker

- Award-winning Cryptocurrency trading platform
- $100 minimum deposit,
- FCA & Cysec regulated

- 20% welcome bonus of upto $10,000
- Minimum deposit $100
- Verify your account before the bonus is credited
- Fund Moneta Markets account with a minimum of $250
- Opt in using the form to claim your 50% deposit bonus
Learn to Trade
Never Miss A Trade Again

Signal Notification
Real-time signal notifications whenever a signal is opened, closes or Updated

Get Alerts
Immediate alerts to your email and mobile phone.

Entry Price Levels
Entry price level for every signal Just choose one of our Top Brokers in the list above to get all this free.